What are the Best Combinations of Forex Indicators for Day Trading?

Many traders are looking for the holy grail of trading by applying dozens of technical indicators to their screen.
Unfortunately, instead of becoming the royal road to profits, most of those indicators are either providing the same information or generate contradictory trading signals which can confuse a trader and lead to whipsaws and losses. Finding the best combination of Forex indicators for day trading can be quite hard – a trend indicator says “buy” when an oscillator says “sell” and vice-versa.
However, by combining different indicators to different timeframes, a trader can take advantage of their strengths and reduce fake signals to a minimum.
Keep reading, and we’ll show you how to day trade with the popular Triple Screen trading system that uses both trend-following and momentum indicators.
- Learn more, take our free course: How to Use Technical Indicators
Trading with Technical Indicators: Yes or No?
Technical indicators are not a standalone trading strategy. Instead, they should be considered as a tool that can be used to confirm or reject a trade setup based on other technical tools, such as price action.
Almost all technical indicators are lagging the price to some extent because they use past price-data to compile their values. Even indicators that are considered leading are still based on old market data. Nevertheless, technical indicators can provide a different perspective of the market by providing information that is not immediately obvious by looking at a bare price-chart.
Relying on technical indicators as the primary source for making trading decisions can be quite dangerous. What indicator or combination of indicators would you follow in day trading? A trend-following indicator will give you buy signals when the trend is up, but an oscillator will reach overbought territories and send you a sell signal. Similarly, a trend-following indicator will trigger a sell signal during uptrends while an oscillator will become oversold and tell you to buy.
Trend indicators work well when markets are trending but give fake signals when markets are ranging. Oscillators are profitable in ranging markets but become (and stay) overbought or oversold as soon as a new trend forms. Following a single indicator won’t work in all market environments while following a pair of indicators will give you contradictory and dangerous signals most of the time.
Still, traders can take advantage of technical indicators in day trading by combining different timeframes to magnify their strengths and minimize their weaknesses. If you understand how trends form, you can combine trend-following indicators with oscillators to find trade setups with a high winning rate. The key is to have a well-defined and robust trading strategy in the first place and to apply indicators which can make it easier to interpret trading signals derived from your strategy.
For example, you could apply a trend indicator on a longer-term timeframe to identify the overall trend and an oscillator to a shorter-term timeframe to find deviations of the price from the underlying trend. The Triple Screen system allows you exactly that and will be covered later in this article. For now, let’s first introduce the main types of indicators, their strengths, and weaknesses.
Types of Indicators
Technical indicators are mostly grouped by the way how they follow the underlying price action.
However, since indicators are based on past price-data, most trend indicators lag the price and give trading signals after a trend has already been established. This means a trader will likely miss the initial move of a new trend until a trend indicator sends a trade signal. Popular trend indicators include moving averages, Parabolic Stop and Reverse (Parabolic SAR), Average Directional Movement Index (ADX) and the Moving Average Convergence Divergence (MACD).
- Learn more, take our free course: Moving Averages Explained
- Learn even more, take our free course: MACD: Fast-track
- Learn more, take our free course: Parabolic SAR: Fast Track
Savvy traders can already conclude that oscillators work extremely well in ranging markets but lead to whipsaws when markets are trending. Popular oscillators include the Relative Strength Index (RSI) and the Stochastic indicator.
Bollinger bands is an overlay indicator, which means that it’s applied directly to the price chart and not in a separate indicator window. Bollinger bands are based on a moving average with two additional lines that are placed 2 standard deviations above and below the moving average itself. When markets are fast, Bollinger bands widen and vice-versa. The ATR indicator is also used to measure the rate of price volatility.
- Learn more, take our free course: Bollinger Bands: Fast Track
The Triple Screen System
The Triple Screen trading system was invented by Elder Alexander and was first presented to the public in 1986. This system uses a triple screen test to identify trade setups that have a high probability of success.
It uses a combination of trend-following indicators and oscillators to reduce the number of false signals to a minimum but applies them to different timeframes. If applied to the same timeframe, those indicators would provide contradictory signals – a trend indicator would yell “buy” when markets are in an uptrend while an oscillator would send a sell signal as soon as it enters into overbought territory.
The basic principle behind the Triple Screen trading system is to enter into the direction of the underlying longer-term trend by waiting for price-corrections that go against the trend. This allows a trader to “buy low, sell high”.
Trends can be observed on any timeframe. Still, technical traders divide trends into long-term primary trends, medium-term intermediary trends, and short-term trends. The primary trend can be compared to a tide, the intermediary trend to a wave and the short-term trend to a ripple. The Triple Screen system trades in the direction of the tide, takes advantage of waves and uses ripples to fine-tune entry points.
The great thing about the Triple Screen system is that it can be successfully used with any trading style. Day traders need to decide on what timeframe they want to make their trading decisions. This will be the second screen in the system, also called the intermediate screen. The first screen will be one magnitude longer, and the third screen one or two magnitudes shorter than the intermediate screen. A day trader can base his trading decisions on the 1-hour chart, which will be his second screen.
In this case, the first screen is the 4-hour chart, and the third screen the 30-minutes or 15-minutes chart.
- Take our free course: Technical Analysis Explained
- Take our free course: Trends, Support & Resistance
- Take our free course: Japanese Candlesticks Decoded
- Take our free course: Reversal Price Patterns
- Take our free course: Continuation Price Patterns
- Take our premium course: Trading for Beginners
Screen 1: Market Tides
In the first screen (the 4-hour chart), we’ll look for market tides, i.e. the direction of the overall trend. Once we identify a trend, we’ll only look to trade in the direction of that trend. For example, if the first screen shows an uptrend, we’ll be trading only with buy positions. Similarly, if the first screen shows a downtrend, we’ll only trade with sell positions.
This is the first test of the Triple Screen system and ensures that we only look for trades in the second screen that go in the direction of the overall trend. Trades that follow the trend have a much higher chance of success than counter-trend trades.
In order to identify the trend on the first screen, the Triple Screen system used the MACD indicator. This indicator is based on two moving averages (a 12-period EMA and a 26-period EMA), which means that its value rises when the trend is up and falls when the trend is down. The value of the MACD histogram is calculated by subtracting the 26-period EMA from the 12-period EMA, adding a 9-period EMA to that result, and plotting a histogram that reflects the difference of the resulting 9-period EMA and the result of the 26-period EMA minus 12-period EMA subtraction.
Don’t worry, your trading platform will do all the hard work for you. Only note that the histogram rises in an uptrend and falls in a downtrend. When the two derived MAs (the 9-period and the 26(minus)12-period EMA) cross, the MACD histogram equals zero.
The following chart shows the NZD/CHF 4-hour chart with the Triple Screen system:
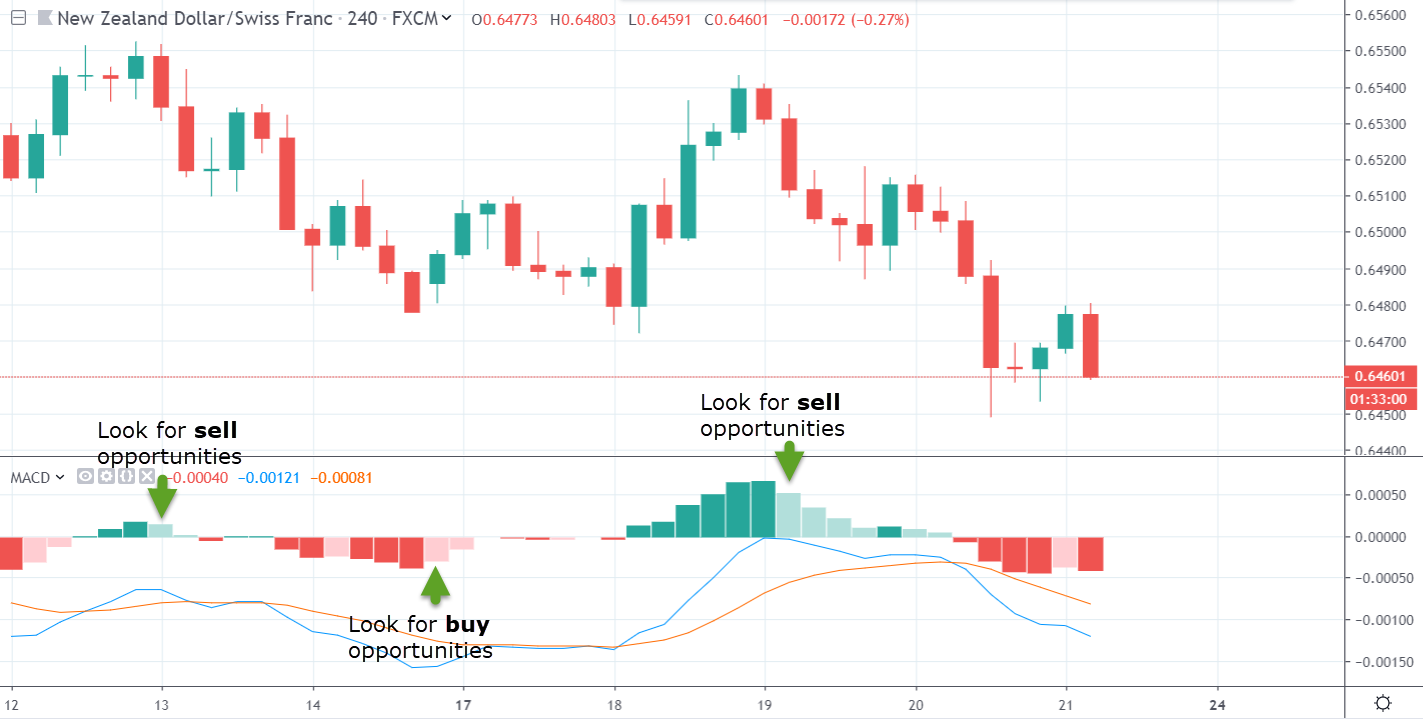
If the MACD histogram ticks higher, we’ll only look for buying opportunities, and if the MACD histogram ticks lower, we’ll only look for selling opportunities in our second screen. If the MACD histogram ticks higher below the centreline, that buy signal is stronger than an up-tick above the centreline. Similarly, if the MACD histogram ticks lower above the centreline, that sell signal is stronger than a down-tick below the centreline.
Screen 2: Waves
In our second screen, which is the 1-hour chart, we’re making our trading decisions. In this screen of the Triple Screen system, an oscillator is applied to identify overbought and oversold market conditions, such as the RSI.
In this phase, we’re looking for price-corrections that go against the trend identified in our first screen. In other words, if the first screen identified a downtrend with the MACD histogram ticking lower, we need to wait for the RSI to become overbought (a reading above 70) to enter with a sell position. If the RSI becomes oversold (a reading below 30), we’ll ignore the buy signal generated by the RSI since that trade would be against the overall trend identified in our first screen.
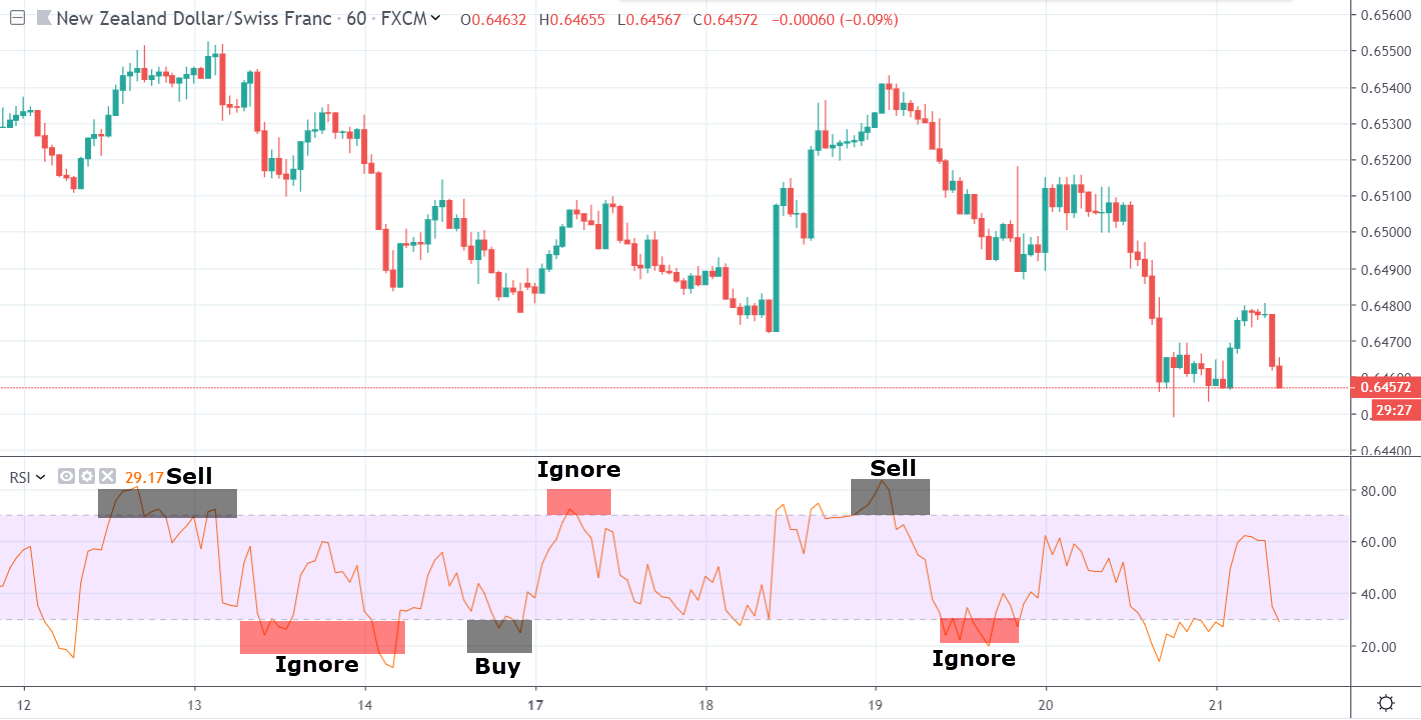
The chart above shows the second screen of the Triple Screen system. Buy and sell signals generated by the RSI that go against the trend direction identified by the MACD in the first screen are ignored and shouldn’t be traded.
Screen 3: Ripples
The third screen of the Triple Screen system represents market ripples. In the original system developed by Elder Alexander, the third screen is used to fine-tune entry points after the first and the second screen confirm a trade opportunity. A day trader can use pending orders such as buy stops and sell stops to enter into the trade. Simply identify short-term support and resistance levels, such as swing highs and lows for example, and place a pending order at that level which will automatically execute a market order after the price breaks above/below that level.
If the first screen shows a downtrend (MACD histogram ticking lower), the oscillator in the second screen becomes overbought (sell signal), then look for short-term support levels in the third screen and place a sell stop a few pips below those levels.
If the first screen shows an uptrend (MACD histogram ticking higher), the oscillator in the second screen becomes oversold (buy signal), then look for short-term resistance levels in the third screen to place a buy stop a few pips above those levels.
In the case of a sell setup, a stop-loss order should be placed a few pips above the high of the current 1-hour candle or above a recent resistance level. With buy setups, place a stop-loss order a few pips below the current 1-hour candle or below a recent support level.
Trading with technical indicators should complement your trading strategy instead of replacing it
Always be aware of the advantages and disadvantage of each technical indicator before starting to risk your trading capital with it.
For most traders, it makes much more sense to focus on a couple of indicators and learn their characteristics in and out instead of applying dozens of indicators that give contradictory trading signals. A trend-following indicator will work great in a trending market but give fake signals when a market starts to rise. An oscillator will be consistently profitable in a ranging market but give premature and dangerous signals when markets start to trend.
The Triple Screen system tries to minimise these disadvantages by combining trend indicators and oscillators on different timeframes and taking advantage of taking trades only in the direction of the overall trend.
The first screen of the system identifies the overall market trend with the MACD indicator, the second screen scans for trade opportunities in the direction of the overall trend with an oscillator, and the third screen provides a zoomed-in picture of potential entry points and triggers a trade with pending orders.
- Learn more, take our premium course: Trading for Beginners