Chapter 18. Technical vs Fundamental Analysis

For an aspiring trader, one of the first things that should be taken care of is the building (and following) of a comprehensive trading strategy.

As we discussed in the previous chapter, this strategy should be based on your trading style, risk aversion, trading capital, financial goals and the method by which you’re going to analyse the market – your edge. 

In this chapter, we’re going to start to introduce you to the main methods of analysis Forex traders use and the strategies they yield. 

Types of market analysis

There are two broad methods of market analysis, briefly introduced in the last chapter, that will help you decide when and how to trade:

Fundamental analysis
Fundamental analysis is the study of economic, social, as well as political forces that affect the supply and demand of a financial asset and the risks that influence its price.

Technical analysis
Technical analysis studies the price movement of an asset, mainly through charts, in order to determine profitable entry and exit points.

Which is the best analysis method?

The answer is both! 

Good technical analysis will tell you ‘when’, good fundamental analysis will tell you ‘why’.

On the Forex markets, traders usually rely on technical analysis to time their entry and exit from the market, while still keeping an eye on the economic calendar – top-down fundamental analysis – to keep abreast of news that can affect market volatility and trigger potential trading opportunities.

Fundamental analysis in the markets

Because fundamental analysts believe all information is not necessarily reflected in the price of an asset, they assume prices and values are different.

Thus, this type of analysis looks at the forces that affect the supply and demand of an asset to work out the value of an asset. 

Once fundamental analysts have determined the intrinsic value of an asset, they can compare it with the current asset’s price to see if the asset is over – or undervalued. Essentially –  value is what you get, price is what you pay. 

The overriding assumption fundamental analysts are making here is that price will eventually revert to value.
If the price of an asset is undervalued, then a fundamental trader would probably decide to buy the asset, as they believe the price should go up. Conversely, if it is overvalued, they should sell the asset, because its price could go down.

The overriding assumption fundamental analysts are making here is that the price will eventually revert to value. 

This is how fundamental traders spot and trade potentially profitable trading opportunities.

Fundamental analysis of currencies

Fundamental analysis in Forex is all about determining what economic factors can affect the supply and demand of a country’s currency. To put it simply, if there is increasing demand, or a reduction in supply, then the trader is assuming the price of a currency will rise. Conversely, if there is a reduction in demand, or an increase in supply, then the price of a currency should fall. If you’ve ever studied economics, you might remember these supply and demand curves, which explain this relationship: 
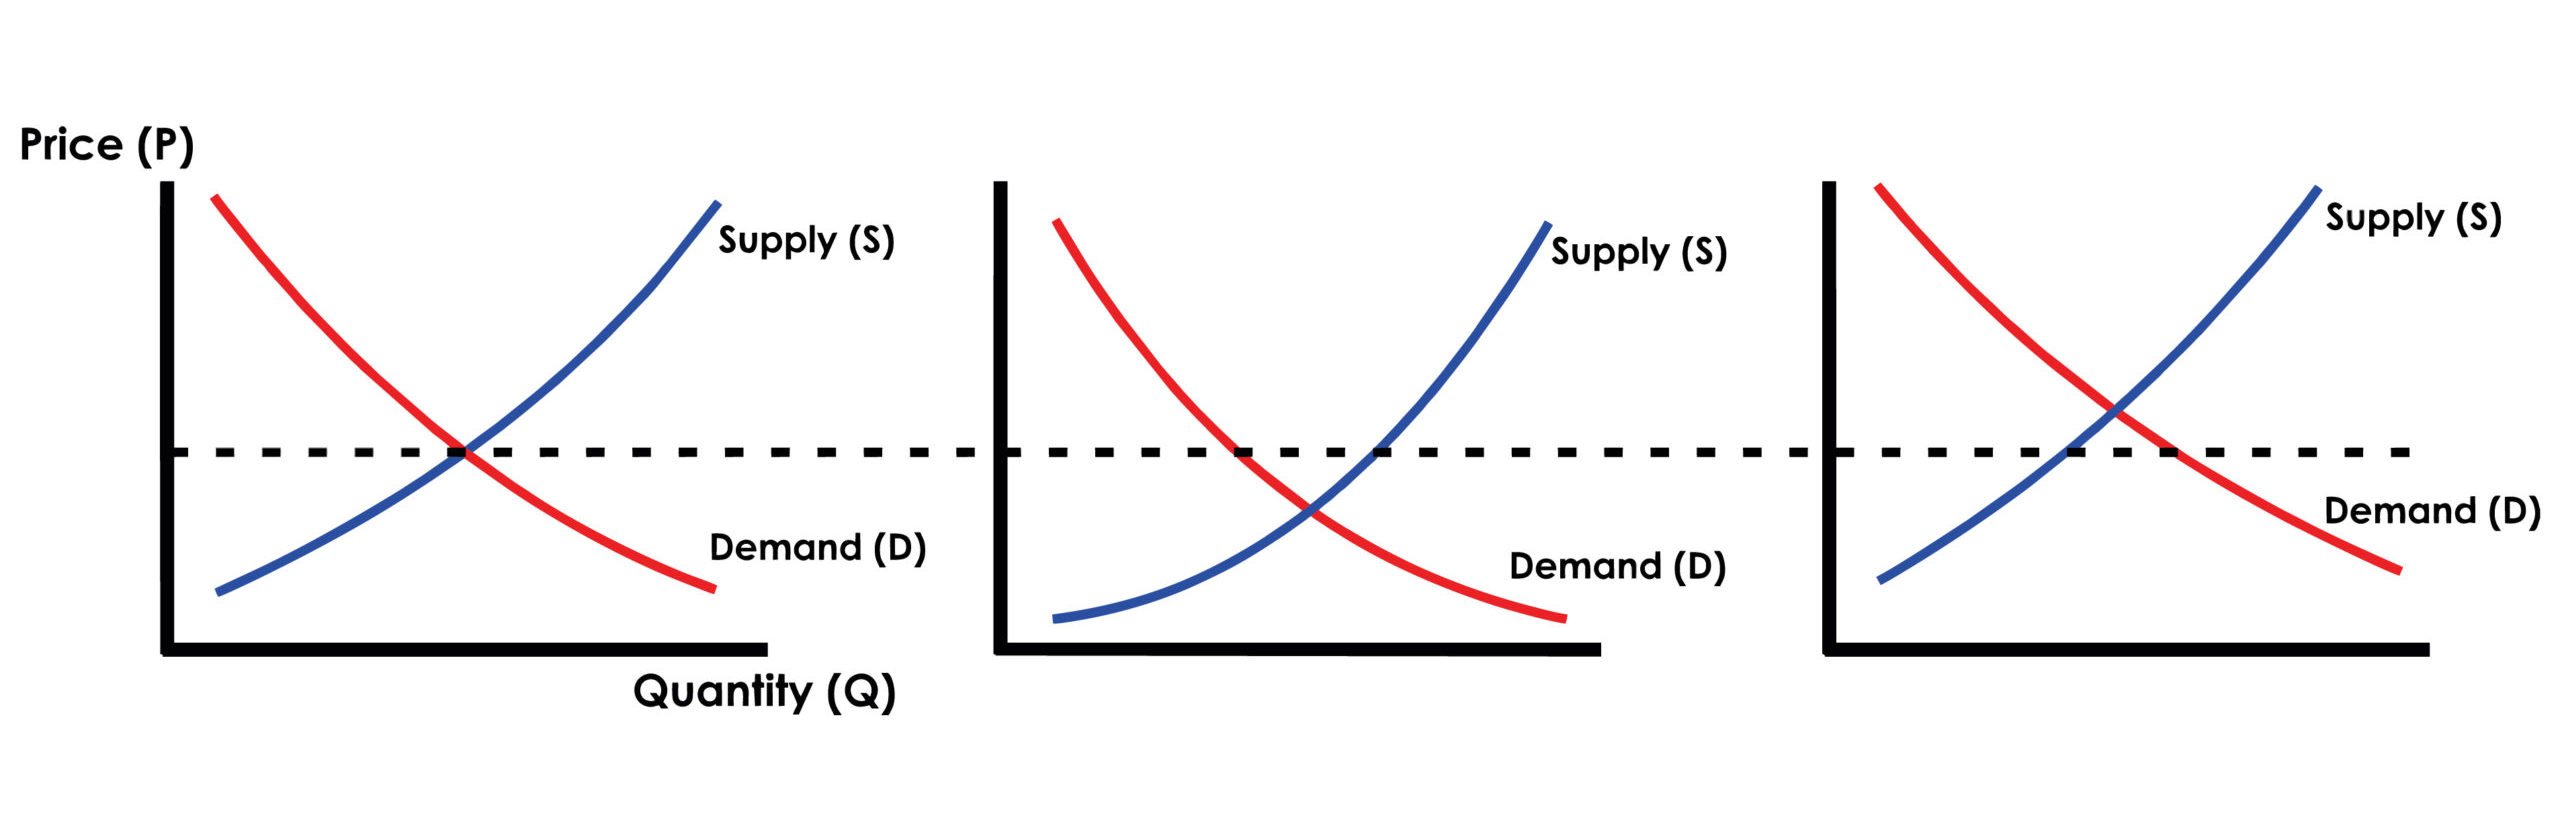
So, the simplest way to analyse the systematic risks which affect the supply and demand of a currency is to follow an economic calendar. This calendar will help you understand the impact of the weakness/strength of a country’s economic stance on its currency.
Live economic calender
Here is today’s and upcoming announcements that traders will be keeping an eye on – if anything is outside what is expected then that might suggest changes in the supply or demand of a currency. For example: if interest rate expectations in a country go up, then all things being equal, demand should go up and therefore the currency should appreciate.
Usually, when a country’s economic outlook is positive, its currency strengthens against its counterparts, as more foreign investors are looking for investment opportunities in this country – and vice-versa.

#1 fundamental strategy: news trading

One of the most well-known examples of a fundamental Forex trading strategy is news trading.

With this strategy, traders open positions based on live economic news being released – either before or after depending if they have a directional bias.

Growth, inflation and employment figures are usually the stats that can trigger the highest volatility
The statistics with the highest impact on the Forex markets are usually the ones that are the most important for the Central Banks – the custodians of a currency.

Growth, inflation and employment figures are usually the stats that can trigger the highest volatility, especially the GDP (Gross Domestic Product), the PCE (Personal Consumption Expenditures) and the CPI (Consumer Price Index), and the unemployment rate as well as the number of jobs created.

With these figures, news traders can take advantage of higher price volatility by determining if the outlook for a country’s currency is good or bad, which will impact the demand for a given currency.

#2 fundamental strategy: currency carry trading

Remember that when trading the currency market, you do not trade individual currencies, but currency pairs. You’re buying one currency, and selling another one simultaneously.

If you hold a trading position on a currency pair for more than a day, then you’ll pay/receive overnight fees depending on the direction of your two positions (long position/short position).

The currency carry trade relies on the differential funding rate between the two currencies – the one you’ll pay and the one you’ll receive. The idea is to borrow money from a currency with a low-interest rate to buy another currency with a higher interest rate, making a profit from the difference.

For years, the Yen with its ultra low interest rates and the Australian Dollar, with its high interest rates was a popular pair for carry traders. 

The carry trade is harder to pull off as a retail trader because of the retail overnight swaps rates. 

Read: All the Different Ways Arbitrage Works

How to use technical analysis

With technical analysis, traders analyse the historical prices and market statistics of an asset to determine where this asset is going next.

Charts are the best way to visualise past prices and recognise patterns, which can give hints about future price movements if the situation repeats itself.

As well as using charts to study market prices, technical traders also use technical indicators, such as Moving Averages Relative Strength Index (RSI), and Bollinger Bands, to develop their technical trading tactics. We will cover technical indicators in a moment.

Technical analysis is based on 3 key assumptions:

  • Prices discount all available information
  • Price moves in trends
  • History repeats itself

Assumption 1: Prices discount all available information

Technical analysis assumes all available information is already factored into the price of an asset. Consequently, studying the price action of an asset is therefore enough to understand what’s going on with the market participants, and there is no need to assess the individual risk factors. 

Assumption 2: Prices move in trends

Technical analysis is based on a major concept – market trends. When prices are trending, the assumption is next price movement is more likely than not to be in the direction of the trend, rather than just being random.

When trading, technical analysts are seeking to identify trends. Trends form in one of three directions:

Read:

What is the trend?

Identifying trends is everything in technical analysis, as every technique, tool, chart pattern, or indicator has the capability to be used in some capacity to determine the trend, and where the asset is within this trend.

A trend represents the general direction of an asset’s price. Charles Dow, considered the father of technical analysis, established that the market has three trends: upward, downward, and sideways (or flat).

To note
An upward trend occurs when prices form higher highs and higher lows – this represents a bullish market.

A downward trend happens when prices reach lower highs and lower lows – this represents a bearish market.

sideways trend is the default if there isn’t an up or downtrend. These often happen when participants are undecided, which means that neither the buyers nor sellers are in control, resulting in sideways moving prices within a range or a lateral consolidation.

Dow also believed that a trend has three parts:

  • Primary – measured in months or years and represents the general direction.
  • Secondary (or intermediate) – usually represents a correction within the primary trend and lasts between three weeks and three months.
  • Minor – represents fluctuations in the secondary trend, usually last less than three weeks.

Assumption 3: History repeats itself

Technical analysts believe that by studying past price movements, they can predict future price actions. The basis of this is market participants behaved in one way in the past and therefore they are more likely to behave in a similar way again.

When they recognise a price pattern that is comparable to what was formed in the past, they know they should buy/sell the asset hoping that the price will evolve in a similar way.

Because market participants keep reacting in the same way, there is a self-fulfilling prophecy aspect in technical analysis.

Trendlines, support and resistance

Spotting the trend of an asset’s price is the principal objective of technical analysis, and trendlines can help determine potential areas where the trend might be reversing.

To be valid, a trendline must be touched by the price at least three times
A trendline connects significant higher lows if the price is following an uptrend – this is an ascending support trend line. Trendlines connect significant lower highs if the price is following a downtrend – a descending resistance trend line.

To be valid, a trend line must be touched by the price at least three times.

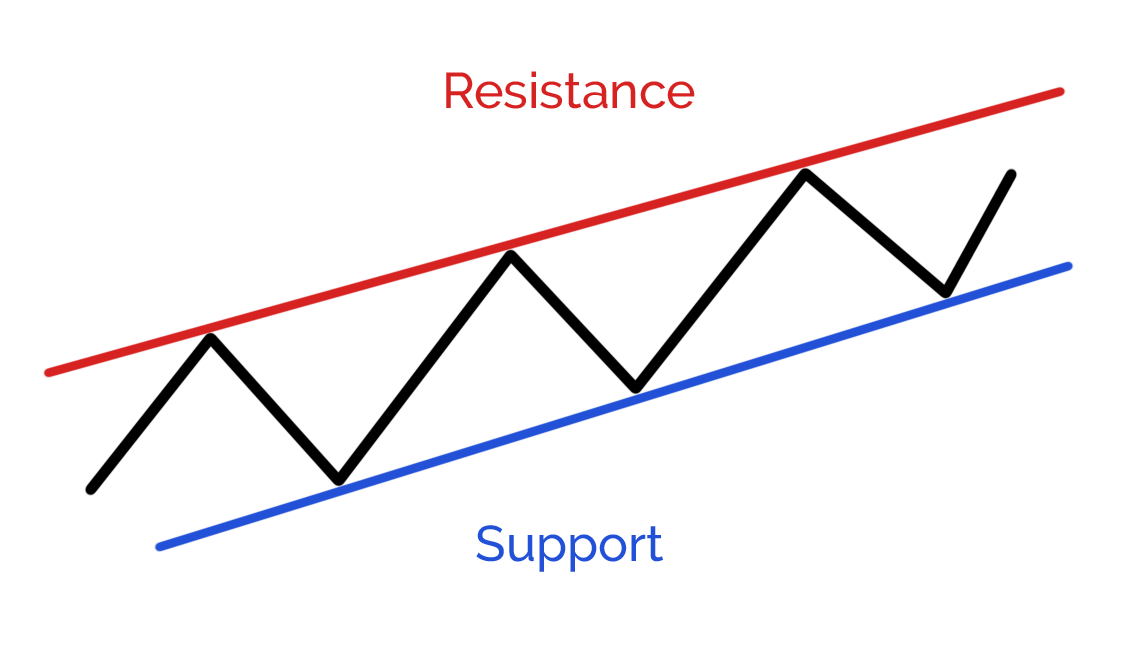
It’s also important that there is a psychological reaction when the price touches the trendline with the price going back up, or down. The steepness of the line should also be “normal” – not too flat, neither too steep.

Let’s recap
Support and resistance levels are essential to determine the trend of an asset.

They also represent levels where prices could reverse to start a new trend, or a new movement in the main trend.

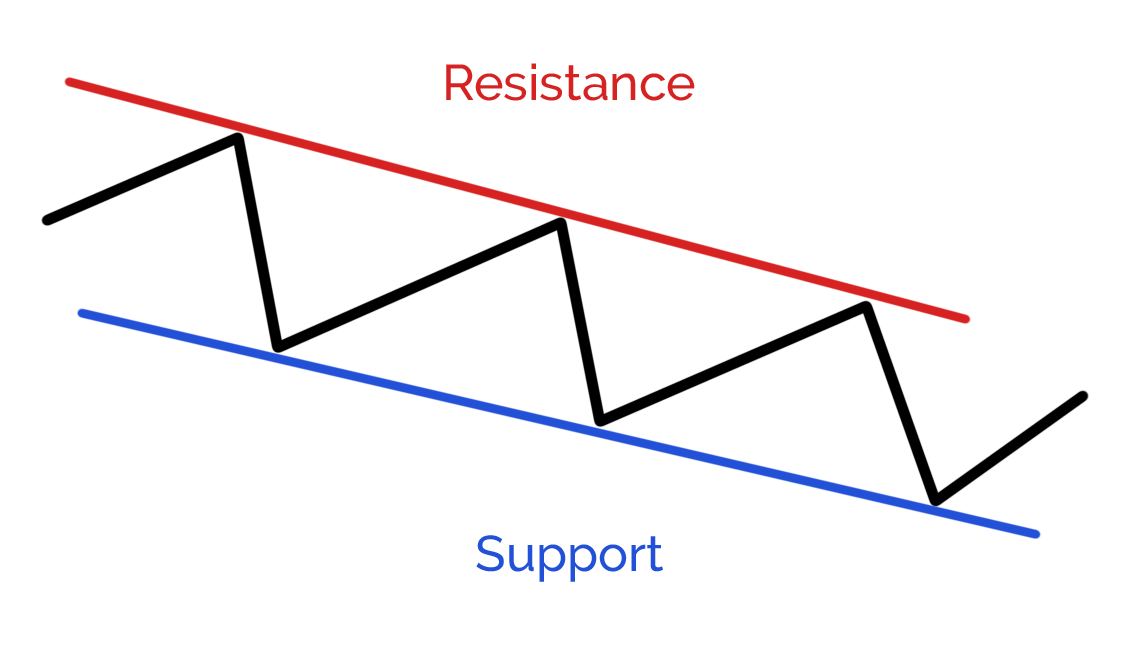
These levels represent zones that have been tested in the past, meaning that there was a “fight” between bulls and bears to take control of the market direction.

Market psychology plays an important role here, as market participants remember this level as being important – and do not forget that in technical analysis the assumption is history tends to repeat itself.

A support level is usually a level where the bulls take control over the bears, stopping prices from falling. Conversely, a resistance level is a level at which the bears take control to stop the price from rising further.

What is price pattern recognition?

Price pattern recognition is a very powerful technique when trying to identify a trend. Price patterns are recognisable, repeatable patterns in the price of a market. 

There are a few things you need to take into consideration when using price patterns to make your trading decisions:

  • Prices should be following an established trend: upward or downward – price patterns appearing in sideways trends are usually not valid.
  • Volatility, the height, and the duration of the pattern in relation to the trend are very important. The bigger the pattern is compared to the previous one and the trend, the more valid the potential outcome would be.
  • Do not enter/exit the market before a pattern is confirmed. Wait for validation, like a breakout for instance.

Here, it’s all about market participant psychological changes that usually materialise themselves in recognisable price patterns. Because traders know about them, they’re able to forecast possible outcomes – in short, price patterns give the trader insights around future price direction.

The different types of price pattern

There are usually three kinds of price patterns:

Continuation patterns
Continuation patterns describe situations where the price trend is likely to follow the current direction. Among the most common continuation patterns are triangles, flags, pennants, as well as the cup and handle.

Reversal patterns
Reversal patterns signal there is a potential change in the current trend of an asset. The most common reversal patterns are the reverse head and shoulder, double or triple top/bottom, wedges, and the rounding top/bottom.

Indecision patterns
Indecision patterns occur when neither buyers or sellers are in control. Usually, indecision patterns can be spotted thanks to candlestick charts with doji and spinning top being the most common of this kind of pattern.

Technical indicators

In addition to support and resistance levels, trendlines, channels, and price patterns, technical analysts also use mathematical indicators, or technical indicators, in their Forex trading strategies.

A technical indicator is simply a formula, the output of which is usually displayed below a chart, or next to the price chart to provide additional information about the trend, support and resistance levels, volatility and momentum.

Technical analysts will mainly use indicators either as an alert, or a confirmation, that the current trend might be changing, or accelerating in the existing direction.

Lagging vs. leading indicators

Trend following indicators determine the dynamics and direction of a market like moving averages. These indicators are often referred to as lagging indicators.

most well known lagging indicators are the MACD, Parabolic SAR, and Bollinger Bands
As a new trader, it would be wise to start with these, as they will help you confirm the trend after it has been established, allowing you to trade with the trend. Among the most well known lagging indicators are the Moving Average Divergence Convergence (MACD), Parabolic SAR, and Bollinger Bands.

Leading indicators can then be used to identify entry and exit points, as they provide early signals about a trend reversal or continuation. Oscillators such as the Stochastic and the Relative Strength Index (RSI) are the best kind of leading indicator, and help traders spot overbought and oversold situations

Technical Indicators: Further learning

To sum up

In summary, fundamental analysis is more of a long-term approach – essentially it will help explain the ‘why’ of a price move. 

Technical analysis helps in determining more accurate entry and exit points over the short-term – essentially it helps with the ‘when’.

While some will argue you need to pick one method and stick to it, our approach is to blend the two, getting the most from each at the right time. 

Start learning now

Learn the skills needed to trade the markets on our Trading for Beginners course.

Register Now

[formidable id=11]

Chapters

Get the Guide as a PDF

Don’t have time to read the MYTS Forex Trading Guide now? Enter your email address below and we’ll send you a PDF copy.

We’ll only use your data for what you consent to. Please see our Privacy Policy.

Request a Free Broker Consultation

Simply answer a few questions about your trading preferences and one of Forest Park FX’s expert brokerage advisers will get in touch to discuss your options.

[formidable id=5]

Information you provide via this form will be shared with Forest Park FX only as per our Privacy Policy.