The Best Futures Trading Strategies You Can Use (And Ones to Avoid)

Futures are a popular trading vehicle that derives its price from the underlying financial instrument.
If you want to get your feet wet with futures contracts and become a successful futures trader, you’ll need to have a well-defined trading strategy that helps you keep your risk under control and avoid emotional trading.
In this article, we’ve prepared our favourite futures trading strategies with an explanation of each strategy. This includes entry and exit points and things you want to avoid when trading the futures market.
- Learn and view trades in real time on our: Trading for Beginners Course
What are Futures?
Futures are popular financial contracts that obligate both parties to transact an asset at a pre-specified price and at a pre-determined future date. Unlike options where the buyer has the right but not an obligation to execute his option, traders who trade with futures must oblige by the terms of the futures contract by the time of its expiration, regardless of the current market price.
The price of a futures contract depends on the underlying asset, its current market price, and the expiration date. Popular underlying assets for futures contracts include physical commodities, such as oil, gold, copper, and natural gas, or financial instruments such as currencies and stocks.
Futures are standardised contracts, meaning that the quantity of the underlying asset is always precisely stated. For example, a futures contract on the British pound has a size of exactly GBP 62,500, a contract on natural gas 10,000 MMBtu (million British thermal units), on Crude oil 1,000 US barrels, and on gold 100 fine troy ounces.
Futures contracts are most commonly used for hedging and speculation purposes. For example, a farmer may want to protect against falling corn prices by buying a futures contract on corn with a predetermined price and execution date. This way, the farmer knows in advance the price at which he can sell his product.
Speculators use futures contracts to speculate on the market and make a profit on falling or rising prices of the underlying instrument. Most futures contracts are not held until their execution date as they can be regularly traded through an exchange. The price of a futures contract depends on the current market price of the underlying instrument.
Read: 22 Day Trading Strategies for Beginners
#1 The Pullback Strategy
The pullback strategy is a powerful futures trading strategy that is based on price pullbacks. A pullback occurs during trending markets when the price breaks above or below a support/resistance level, reverses and retests that broken level again.
During uptrends, the price breaks above a well-established resistance level, reverses and retests the resistance level. Once the retest is complete, a trader would enter with a long position in the direction of the underlying uptrend.
During downtrends, the price breaks below a well-established support level, reverses and retests the support level again. This is a pullback, and a trader would enter with a short position in the direction of the underlying downtrend.
The following chart shows two pullbacks (points 3 and 4) to a previously broken support level which now acts as a resistance.
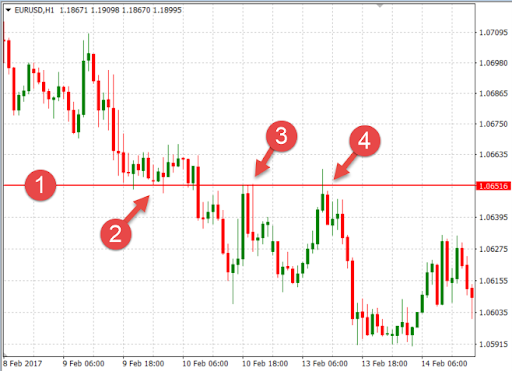
Pullbacks form when market participants start to take profits, pushing the price in the opposite direction of the initial breakout. Market participants who missed out the initial price-move are waiting for the price to return to the broken support/resistance level in order to enter at a more favourable price, pushing the price up again.
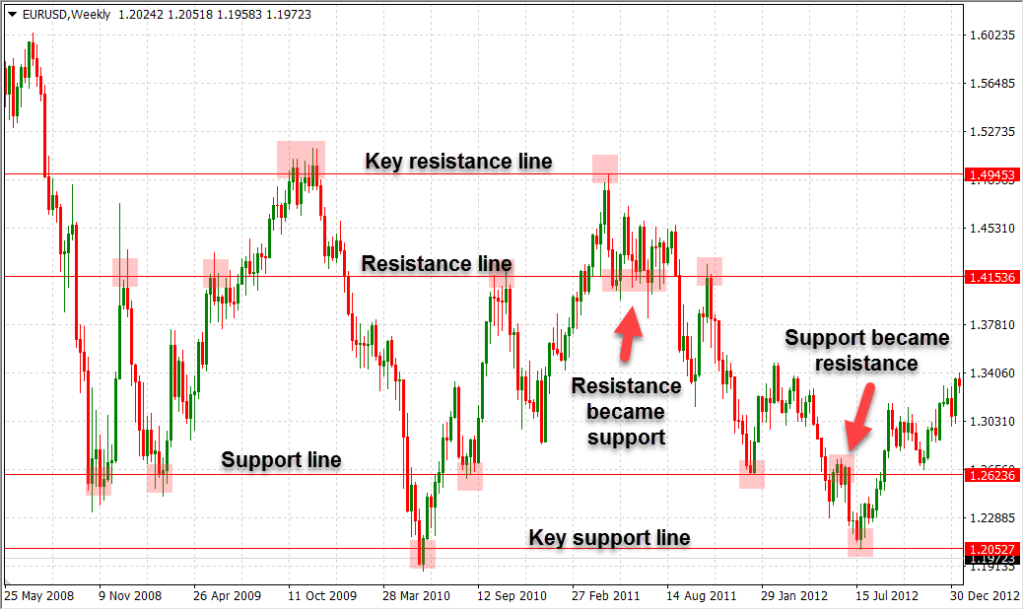
Pullbacks take advantage of an important phenomenon in technical analysis. When an important support or resistance level breaks, that level changes its nature and becomes a resistance or support level, respectively.
A broken support level becomes a resistance level, and a broken resistance level becomes a support level. This is especially true on higher timeframes, such as the daily, although it can also be observed on shorter-term timeframes, such as the 30-minutes or 1-hour ones.
When trading pullbacks, traders should place stop-loss orders just below the retested support level (previously resistance) during uptrends, and aim for the recent highs as their profit target.
Similarly, stop-losses should be placed above the retested resistance level (previously support) during a downtrend, with profit targets set at recent lows.
Read:
#2 Trading the Range
Trading the range refers to trading the bounce off important support and resistance levels in a chart. Certain markets like to trend, such as stocks, while others like currencies like to trade in a range.
Most market participants are still humans who have emotions and memories. When the market has difficulties to break above a certain price level, market participants will refer to that level as a resistance level. When the price reaches the same level again, some traders will start to take profits and others will open short positions in the market, both of which will increase selling pressure on the financial instrument and likely send the price down.
On the other hand, when the price has difficulties to break below a certain level and reaches that same level again, market participants who have been already shorting the market might start taking profits while other will start buying at those lower prices, both of which will increase buying pressure on the financial instrument and likely send the price up. Those levels are referred to as support levels.
The following chart shows how the price usually behaves around important support and resistance levels.
When trading the range, the first thing you need to care about is whether the market is actually trading in a range (sideways). If there’s an absence of higher highs or lower lows in the price, both of which are signs of a trending market, then the current market environment is likely a ranging market.
Alternatively, you could use trend-following technical indicators such as the ADX indicator. An ADX value below 25 signals that the market is not in a trend.
Place your stop-loss levels just above an important resistance level if you’re shorting the market, or just below an important support level if you’re buying the market.
You don’t want to stay inside a trade if the traded support/resistance level gets broken, so place the stop-loss level near the level but add some room to account for fake breakouts, volatility, and market noise. Profit targets should be placed near recent highs/lows, S/R zones or other important technical levels.
Read:
#3 Breakout Trading
One of the most popular approaches in day trading, breakout trading has a huge following among futures traders. As its name suggests, breakout trading aims to catch the market volatility that occurs when the price is breaking out of chart patterns, channels, trendlines, horizontal S/R levels, and other technical levels.
Popular chart patterns for trading breakouts include the head and shoulders pattern (trading the neckline breakout), rectangle, pennant and triangle patterns that often signal a continuation of the underlying trend, and double tops and bottoms.
- Learn more, take our premium course: Trading for Beginners
Just after a breakout occurs, the market usually experiences increased volatility as numerous pending orders become executed. Breakout traders try to take advantage of that volatility rise by taking positions in the direction of the breakout.
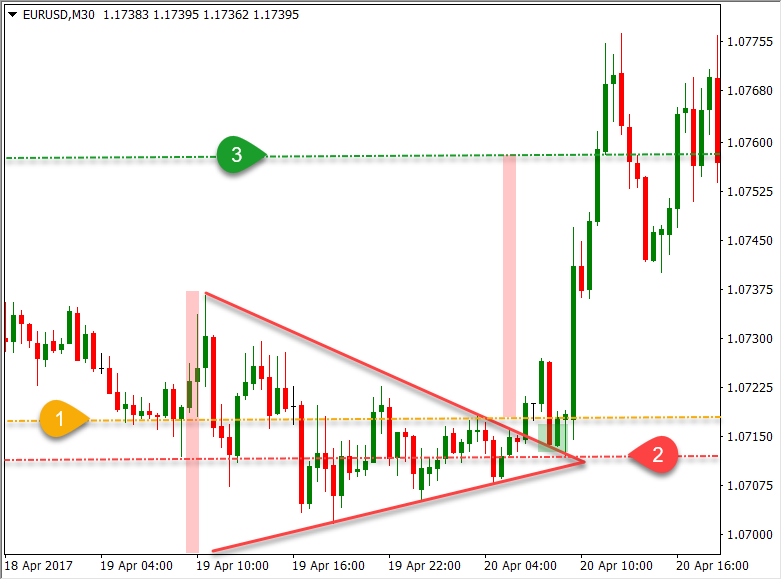
The chart above shows how to trade a symmetrical triangle breakout with a consecutive pullback. Line no. 1 shows a potential entry-level, with line no. 3 acting as a profit target.
Pending orders are often used by breakout day traders to catch a breakout trade. Pending orders such as buy stops and sell stops become market orders when the price reaches the pre-specified price-level. This way, traders don’t have to wait for the actual breakout to occur in order to catch the consecutive volatility.
Stop-loss levels are usually placed just above (for short positions) or below (for long positions) the technical level where the price broke out. Markets often form pullbacks to the broken technical level which allows traders to add to their open positions and new traders to join the market.
Take-profit targets depend on the type of breakout. For example, a head and shoulders pattern projects a profit target that is equal to the height of the pattern, measured from the neckline to the top of the head which is then projected from the breakout point.
Triangle and rectangle patterns have a profit target that is equal to the height of those patterns measured from their base.
Alternatively, traders can also set other profit targets based on recent swing highs and lows or shorter-term support and resistance levels.
- Learn more, take our premium course: Trading for Beginners
#4 Fundamental Trading Strategy
While most of the futures trading strategies explained in this article are technical in their nature, you need to be aware that most high-volatility price-moves are a byproduct of changes in the underlying instrument’s fundamentals. Fundamentals initiate and reverse trends and break important support and resistance levels.
Professional futures traders need to be up-to-date on fundamental developments of the traded financial instrument. As a rule of thumb, fundamental traders base 80% of their trading decisions on fundamentals and 20% on technicals.
One of the main drawbacks of fundamental analysis is that it doesn’t provide exact price-levels to trade on, and that’s where technical analysis comes into play. Fundamentals are used to determine whether to go long or short, and technicals to set profit targets and stop-loss levels.
- Take our free course: Technical Analysis Explained
- Take our free course: Trends, Support & Resistance
- Take our free course: Japanese Candlesticks Decoded
- Take our free course: Reversal Price Patterns
- Take our free course: Continuation Price Patterns
- Take our premium course: Trading for Beginners
An easy yet effective fundamental trading strategy is to follow micro-fundamental releases. Check the trend for the last three reports. For example, if you’re trading futures on currencies, then economic growth reports, inflation reports, and labour market data can have a tremendous impact on exchange rates.
Central banks follow these reports to adjust their monetary policy. When economic growth is slowing down, inflation doesn’t pick up and unemployment rates are rising, central banks usually cut rates to stimulate economic activity.
The opposite is true when economic growth is high, inflation reports are near the central bank’s inflation target and labour markets are strong – that’s when central banks usually hike interest rates to prevent the economy from overheating. Rate cuts cause the domestic currency to fall, while rate hikes lead to currency appreciations.
By following these reports and their last three releases, traders can get an idea of where the central bank’s policy is heading. Is there a higher probability for a rate cut or rate hike? Get your trading direction from fundamentals, and use technicals to fine-tune entry and exit targets.
The same strategy can be applied to other markets as well, such as the futures on stocks, commodities, and metals.
#5 Buyer and Seller Interest
Traders utilise the data of buyer and seller interest to decide whether to buy or sell a futures contract. Buyer and seller interest is determined by the Depth of Market (DoM) window, which shows the number of open buy and sell orders for a futures contract at a number of price levels.
The Depth of Market shows the liquidity for the underlying security – a higher number of market orders at each price means higher liquidity, and vice versa.
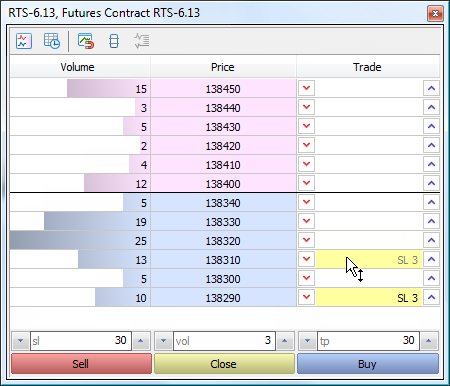
Graphic: A Depth of Market window in MetaTrader 5. Source: https://www.metatrader5.com/i/help/terminal/en/dom_stops_move.png
Some brokers refer to the Depth of Market as the Order Book, as it shows the number of pending orders for the underlying security or currency. These lists are updated in real-time to reflect the current trading activity in the market.
Large trading orders won’t affect the price of a highly-liquid security, such as Amazon, to a large extent. However, if the depth of the market and liquidity is low, even small trading orders can have a significant impact on the price.
Traders can create powerful trading strategies built around the Depth of Market or Order Book.
For example, if stock X currently trades at $50, and the DoM of the stock shows that there are 100 buy orders at $50.10, 200 at $50.50, 400 at $50.80 and 250 at $51.00, while the sell-side shows 40 orders at $49.90, 60 orders at $49.70 and 150 orders at $49.60, a trader could come to the conclusion that there’s overall a higher buying interest than selling interest in the stock.
Stocks and other financial instruments tend to gravitate toward those price-levels that have the largest number of orders.
Read: What are Key Chart Levels? (And How to Trade Them)
#6 Trend-Following
Some of the best futures trading strategies are trend-following strategies. They (mostly) work, have a proven track record and are quite easy to follow.
So, what is a trend-following strategy?
As its name suggests, these strategies aim to enter in the direction of the underlying trend. If the trend is up, a trend-following strategy would only look for suitable long positions. Similarly, if the trend is down, a trend-following strategy would only look for potential short positions.
You may have heard the saying “buy low, sell high” and “the trend is your friend.” But, how can a trader know at what “low” to buy and what “high” is high enough?
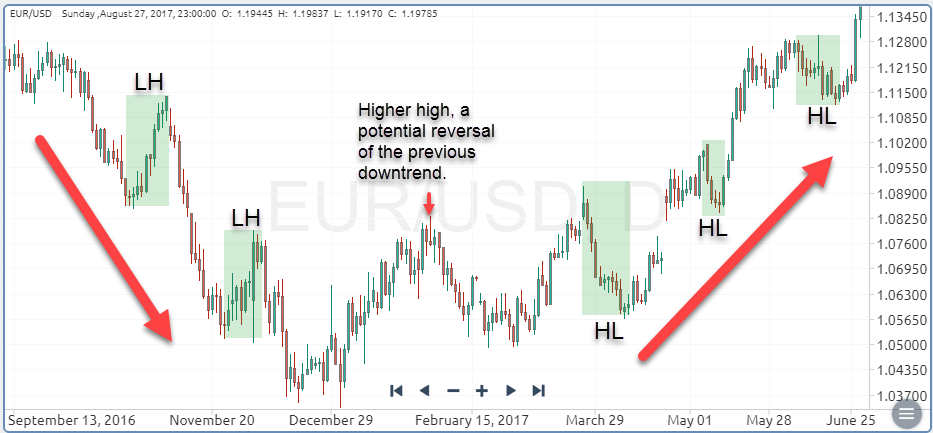
To answer that important question, let’s quickly cover how trends form. In an uptrend, the price makes higher highs and higher lows with each higher low representing a counter-trend move. Those counter-trend moves are price corrections that form as the result of profit-taking activities, or when sellers start to pushing an overstretched up-move lower.
The best time to buy during an uptrend is at the higher low, i.e. the bottom of the price correction. This is exactly the point where the underlying uptrend should resume. The same is true for downtrends, only that you would look for the tops of lower highs to enter with a sell position.
Take a look at the following chart. The tops of the lower highs (LHs) are used to enter with a short position, while the lows of the higher lows (HLs) are used to enter with a buy position. The areas in green shadows represent price corrections during a trending market.
According to the Dow theory, a price correction reaches on average 50% of the initial impulse move. In terms of Fibonacci levels, look for retracements between 38.2% and 61.8%.
#7 Counter-Trend Trading
Counter-trend trading refers to taking positions in the opposite direction of the underlying trend. For example, a counter-trend trader would look for sell opportunities during uptrends and buy opportunities during downtrends.
Counter-trend traders try to take advantage of the price correction that succeeds each impulse move and place their profit targets at around 50% of the impulse move or at an important Fibonacci level. Counter-trend trading strategies are usually riskier than the other strategies explained in this article and should only be used by experienced traders.
Futures Trading Strategies to Avoid
While there’s no doubt that having an effective trading strategy can significantly improve your trading performance, there are also certain points and strategies that you should avoid. Here’re the most important ones:
- Trading highly illiquid markets – The liquidity of the market depends on the number of buyers and sellers at each price level. A highly-liquid financial instrument, such as the EUR/USD pair or stocks of blue-chip companies like Apple, have a large number of market participants ready to jump into the market at almost any price-level around the current market price. This reduces the volatility of the security or currency pair, but also the associated trading risks. Illiquid financial instruments can fluctuate a lot even on small trading orders, which can quickly lead to large losses.
- Scalping strategies – Scalping is a popular short-term trading style that tries to take advantage of very small price movements on very short-term timeframes. Scalping is fast-paced and exciting and attracts many traders, especially those who are just getting started with trading. Unfortunately, those traders often end up with heavy losses. To be consistently profitable with scalping, you’ll need experience, discipline, and nerves of steel. First learn how to trade profitably with longer-term trading styles, such as swing trading and day trading, before getting your feet wet with scalping.
- Holding trades overnight / over the weekend – Each time you decide you hold a trade overnight or over the weekend, you can be exposed to unfavourable market events that can lead to losses. This is especially true when holding trades over the weekend.
Final Words
Futures trading can be a very exciting and lucrative endeavour if you have a well-defined trading strategy and risk management.
If you’re a beginner to the market, then give the pullback strategy a try. It’s a popular trading approach with a huge following base among retail futures traders. We also like trend-following strategies and trading in the direction of the trend.
Whichever trading strategy you choose, bear in mind to trade liquid markets and to close your positions overnight (if you’re a day trader) and over the weekend (if you don’t want take on additional risk.)
- Learn more, take our premium course: Trading for Beginners