
Let’s get started on continuation patterns. Triangles are a family of patterns, and we’ll introduce the first member now.
Ascending Triangles
Triangle patterns are when price action narrows and coils between a horizontal resistance line and an ascending support line, before breaking out and continuing in the direction of the preceding trend.
Appearing uptrends, an ascending triangle is a bullish or, very occasionally when in a downtrend, a bearish formation.
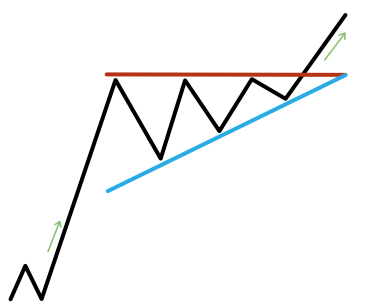
The confirmation comes when the price breaks the resistance line, additional confirmation is obtained if price returns and finds support at the recently broken horizontal resistance.
The bearish ascending triangle appears in downtrends, with the price breaking to the downside of the support level.
Trading an ascending triangle
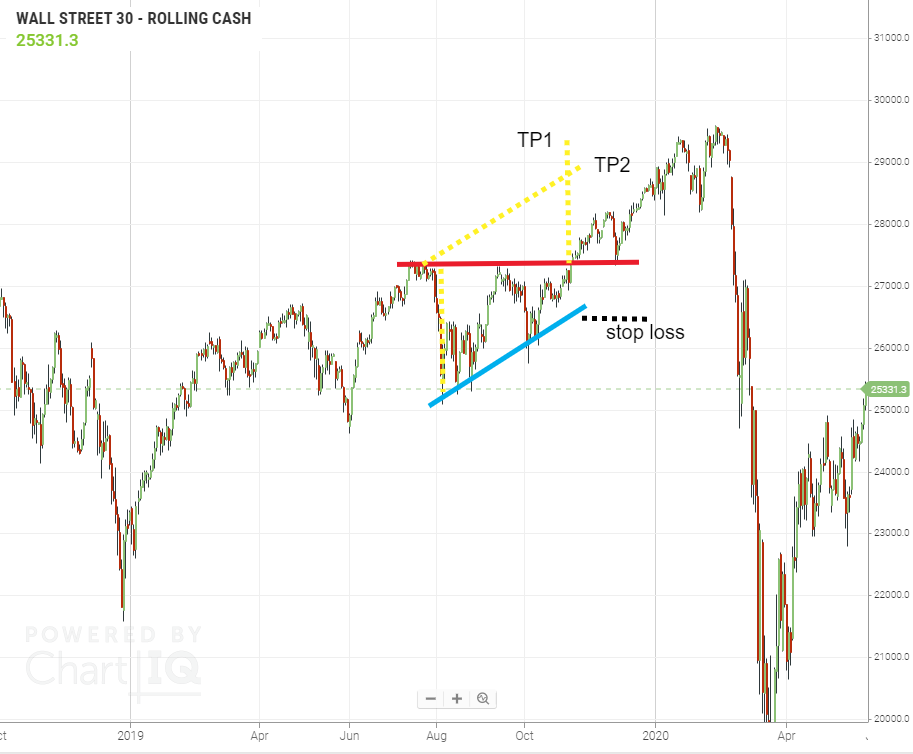
Remember, traders should only trade this pattern if it is confirmed, don’t second guess it. The next step is to assess its size to see how much weight to give it in our analysis. If it is confirmed and significant enough to trade, traders then decide price targets to set their limit orders at and risk management levels to set their stop-loss orders. For a typical trader using this pattern to place a trade, this would be done as follows:
- Price target 1: the height of the triangle at its highest point, projected up from the breakout; or
- Price target 2: mirror a parallel of the support line up from the first resistance touch, this provides a more dynamic price target.
- The stop can be set under the pattern’s support line. If breached this would invalidate the continuation potential of the pattern.
Let’s show you an example with Wall Street 30 (Dow/DJIA). There is a trend into the pattern, its of a decent duration – 60 periods and the breakout above resistance confirmed the trade. The price actually retraced and tested the breakout level shortly after, which is additional confirmation of the pattern. This trade would have played out in our favour.
- Triangle patterns are where the price action narrows and coils between S&R before continuing in the direction of the trend.
- An ascending triangle is a long term bullish, and occasionally, a bearish formation.
- The pattern can help create a price target. Price targets provide traders with objective exit levels.