
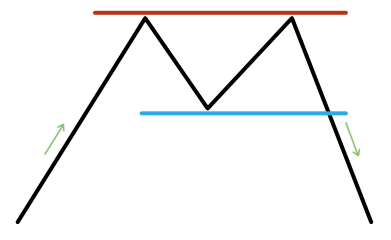
Double tops
These are the bearish version of the reversal pattern, appearing in an uptrend and switching to a downtrend. Resistance forms at a new high but the next high is broadly level with it. In a strong uptrend, we’d expect the new high to be higher – because we don’t see this we can imply the bulls are losing momentum. The confirmation of this pattern comes when the price breaks down through the lower support line created at the initial low.
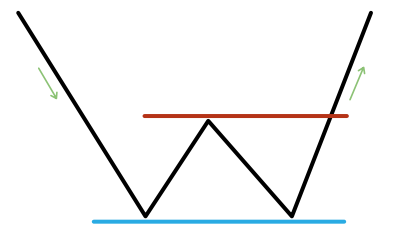
Double bottoms
The double bottom pattern is the inverse, it is the bears losing the momentum instead.
Trading double tops and bottoms
For both the double top and bottom the trader is seeking to profit from the trend after the pattern has confirmed – for tops this means going short, for bottoms going long. Price targets and risk management levels can be set using the pattern as follows:
- Price target: for double tops the take profit target is set by projecting the height of the pattern, down below the breakout from support.
- Price target: for double bottoms the take profit target is set by projecting the height of the pattern, up above the breakout from resistance.
- Stop loss: for double tops its set above the support level.
- Stop loss: for double bottoms its set below the resistance level.
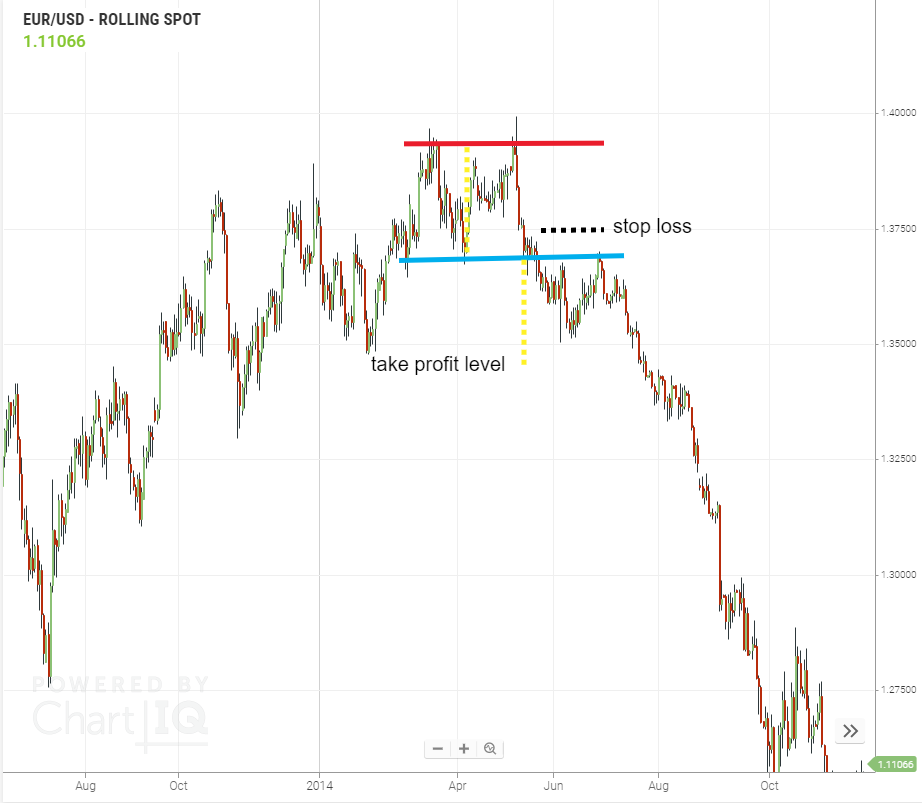
Let’s show you a double top playing out on a chart of EUR/USD. There is an uptrend into the pattern, the prevailing trend line breaks during the pattern, the second high is level with the first and note the rapid move down the after the second high – this is a very bearish sign. After breaking support initially price returned and tested the old level, now as resistance. If the test is rejected, which it was, that is further confirmation of the pattern and another opportunity to go short.
- A double top is a bearish reversal pattern, a double bottom is a bullish reversal pattern.
- The double top pattern is not confirmed until the support line is broken, the double bottom until resistance is broken.
- Traders can use the pattern to set take profit targets and stop-loss levels.