
Fibonacci in trading
We can use the Fibonacci sequence to help us identify support and resistance levels.
Fibonacci retracements
Fibonacci retracements are often applied to charts after an extensive up or downtrend, with horizontal retracements drawn at 23.6%, 38.2%, 50% and 61.8% retracements of the initial move. These percentages are ratios extracted from the Fibonacci sequence.
| Fib retracement level: | Why this percentage: | Example: |
| 61.8% | The ratio each number increases by | 21/34 = 0.618 |
| 38.2% | The ratio if you skip a number | 21/55 = 0.382 |
| 23.6% | The ratio if you skip two numbers | 21/89 = 0.236 |
| 50% | The ratio of the 1 and 2 in the sequence | 1/2 = 0.5 |
Adding to a chart
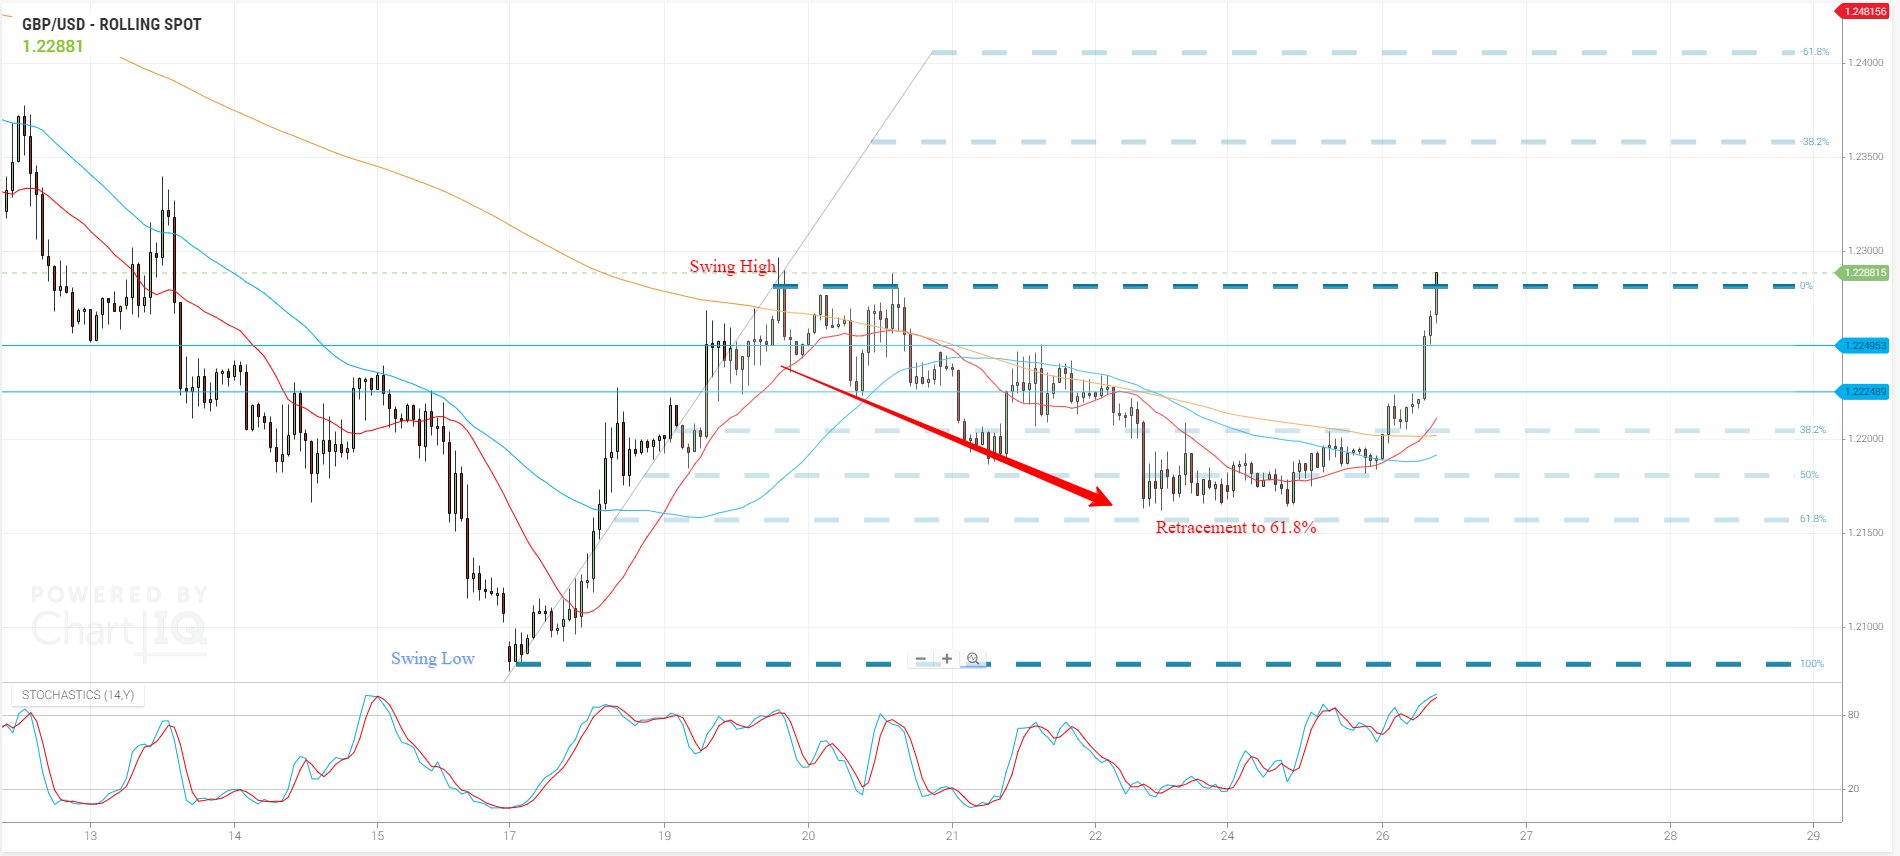
As traders, we just need to specify the trend we are analysing and the charting package will do the rest. Let’s look at Cable, where the initial bullish trend being analysed retraced to around 61.8%, where it found support and the bulls took control again:
Once the initial trend is known and the retracement levels set we’d treat them similar to horizontal support and resistance areas drawn out from previous highs and lows or round numbers. We showed you how to analyse support and resistance in our short course Trends, Support and Resistance, so we won’t go over it again here. Make sure you add Fib retracements to your toolkit when analysing S&R.
The other uses of Fibonacci
Retracements are the most popular but Fibonacci is used in many other methods of analysis. Other uses include extensions, expansions, time zones, arcs and fans, among others. All are different takes on how to apply the Fibonacci sequence and all are used to help identify support and resistance.
- The Fibonacci sequence is used by traders to help identify potential support and resistance levels.
- Fibonacci is used in many methods of analysis, retracements are the most popular.