
Head and shoulders
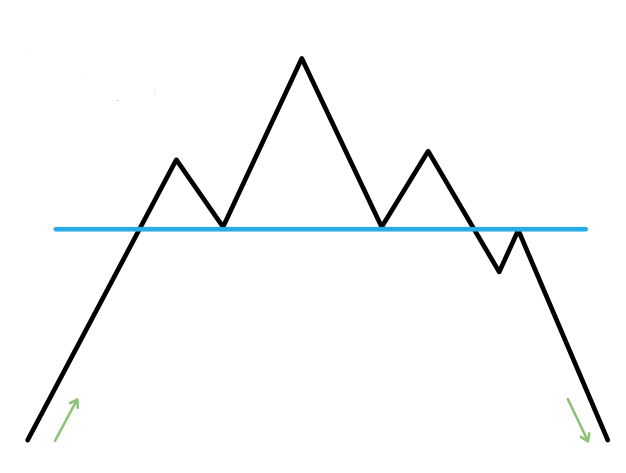
Head and shoulders is a bearish reversal pattern which forms in an uptrend and its completion indicates a trend reversal. With three peaks it is similar to a triple top, however, the second peak is higher and forms the head. The two lows create a support line which is called the neckline, once this line is broken after the second shoulder we get confirmation of the pattern. The slope of the neckline impacts how bearish the pattern is – a downward slope is more bearish.
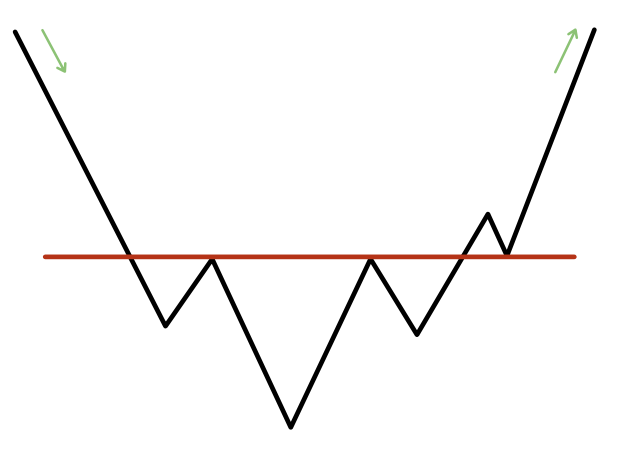
Inverse head and shoulders
Like many patterns, the head and shoulders has a bullish or inverse version, however, these are rarer.
Trading the patterns
Traders would trade these patterns in a similar way to the other reversal patterns introduced so far. After checking there is a good trend in, durations, volatility and height of the patterns should all be taken into account. The head and shoulders has an additional two variables to check, which is the slope of the neckline and if volume data can be obtained for the market, then lookout for an increase in volume on the move after the high/low of the second shoulder, this again adds weight to the pattern.
- Price target for head and shoulders is set by projecting the height of the pattern at the head, down below the breakout from support.
- Price target for inverse head and shoulders is set by projecting the height of the pattern at the head, up above the breakout from resistance.
- Stop loss for head and shoulders can be set above the support level.
- Stop loss for inverse head and shoulders can be set below the resistance level.
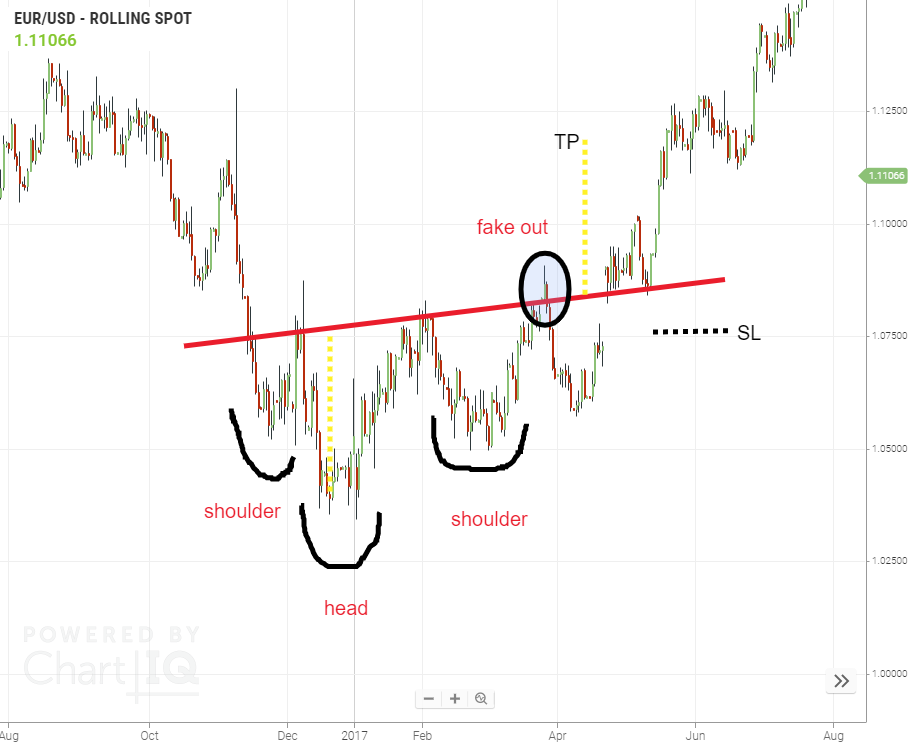
Let’s look at an inverse head and shoulders on a daily chart of EUR/USD. This pattern didn’t quite play out as expected. There is a downward trend into the pattern, the head and shoulders form, the resistance level is sloping up, which is bullish. However, there is a fakeout over a couple of candles, this would have probably been enough confirmation for an aggressive trader to go long. The price then retraces sharply and would have taken out the stop loss. The reversal did eventually happen but it would have been harder to trade – remember, we are trading percentages and not absolutes, and this is a good example of why you should risk manage your trade.
- Head and shoulders is a bearish reversal pattern.
- Confirmation of this pattern occurs when the price breaks through the support line.
- As well as volatility, duration and height, the slope of neckline and volume on the move after the second shoulder add to the weight of the pattern.
- The inverse head and shoulders is the bullish version, but these are rare.