
Welcome, we’ve split this fast-track course into two theory and one practical lesson. We’re going to explain what MACD is in the first one, then in the second show you how it is used.
What is MACD?
MACD stands for Moving Average Convergence Divergence. It is a lagging indicator that measures price momentum. It combines and tidies up several strands of analysis using moving averages into a single indicator.
MACD has three parts
- The MACD line, the difference between two exponential moving averages of the price. Traders typically set these two EMAs at 12 and 26 periods.
- The signal line, which is an exponential moving average of the MACD line, normally set to 9 periods.
- A histogram, the result of the signal line subtracted from the MACD line.
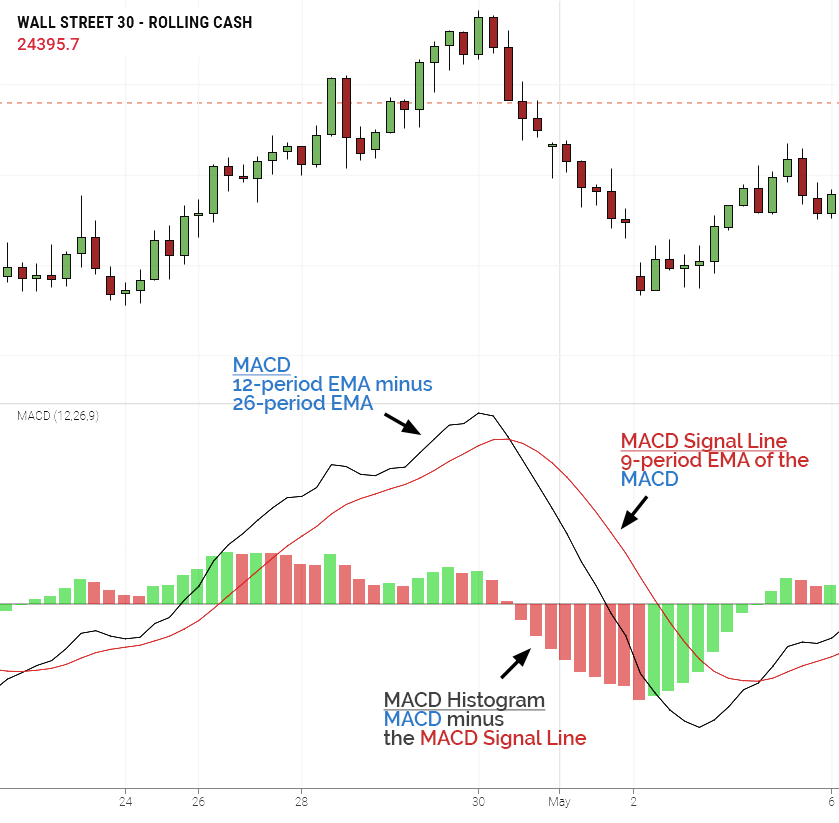
When you have two moving averages together, the slower one has more lag and the faster one reacts quicker to price changes. By plotting a line that shows us the difference, the MACD line tells us if there is momentum in the price and, if the line is changing, the direction of the momentum. If there is lots of momentum and the price is changing quickly, the shorter period EMA will follow it quickly, the longer period EMA lags behind this. The more momentum the wider the two EMAs and the more extreme the MACD line.
There are lots of calculations going on with each element, so instead of detailing each formula here, we’ve added a worked example to the materials section so you can scrutinize the calculation if you so choose. The good news is your charts package will calculate all this automatically.
How MACD reacts to price change
Remember we’re analysing price momentum with MACD.
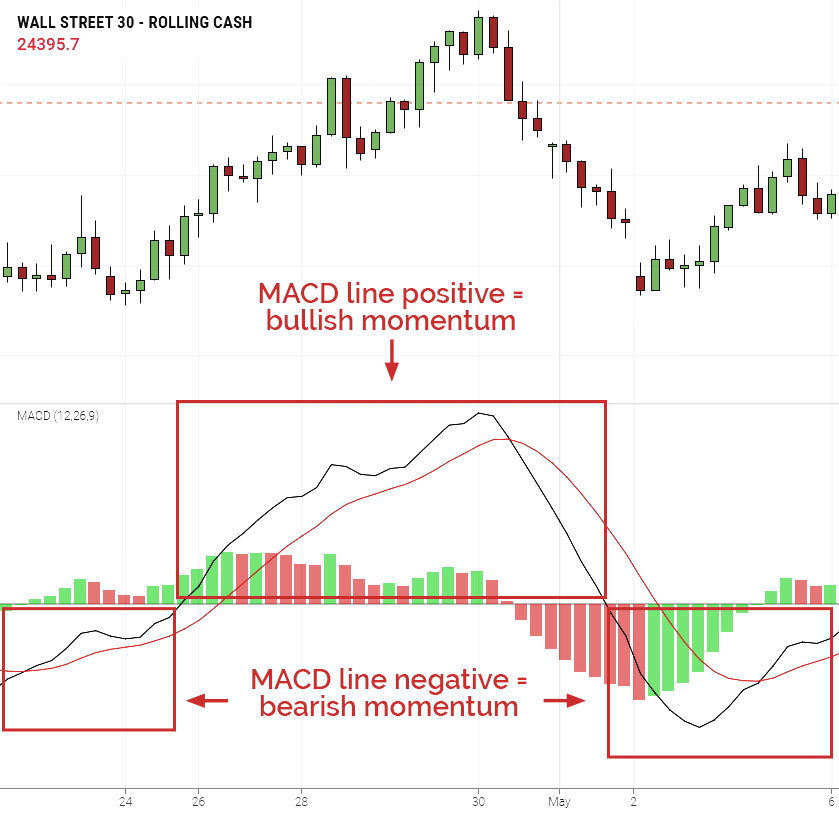
Let’s just concentrate on the MACD line and we’ll explain how the other two are used in the next lesson. For the MACD line to be positive the shorter EMA of the price is above the longer one – because there is less lag in a shorter EMA this would indicate there is an upward, or bullish, momentum.
If the MACD line is negative the shorter EMA is below the longer-term EMA and indicates bearish momentum.
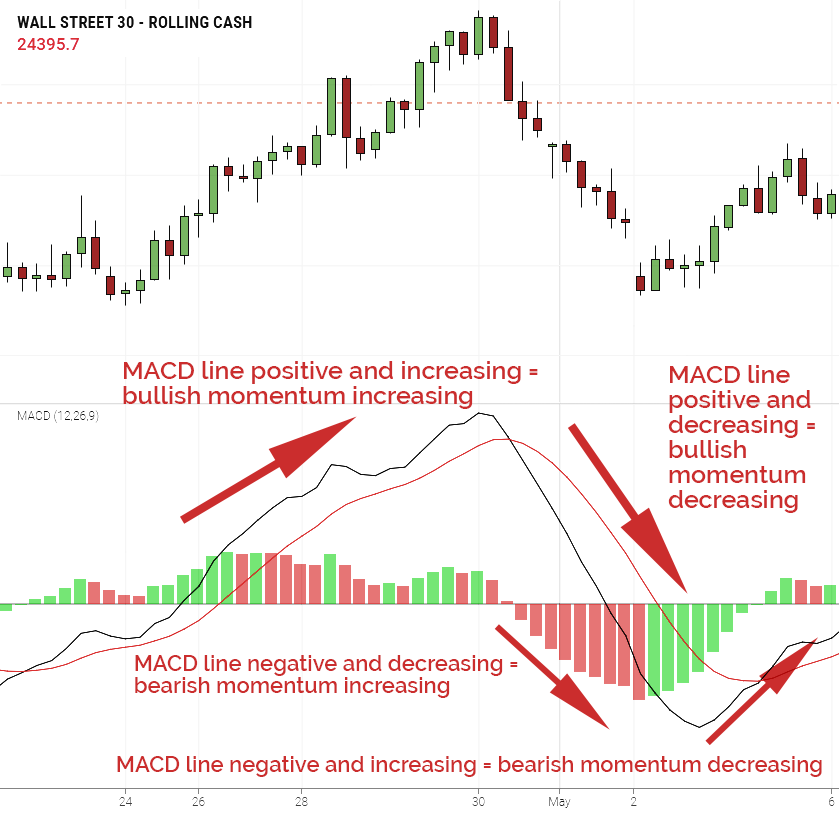
If the MACD line is above zero and increasing, this indicates bullish momentum is increasing and when the MACD line is above zero and decreasing this indicates the bullish momentum is reducing. If the MACD line is below zero and decreasing, this indicates bearish momentum is increasing and when the MACD line is below zero and increasing this indicates the bearish momentum is reducing.
- MACD stands for Moving Average Convergence Divergence. It combines moving averages to deliver a simple indicator.
- MACD measures price momentum.
- There are three elements to MACD: the MACD line, the signal line and the histogram.
- When the MACD line is positive it indicates bullish price momentum, when negative bearish price momentum.
- When the MACD line is positive and increasing it indicates bullish price momentum is increasing. If positive and decreasing, then bullish price momentum is reducing.
- When the MACD line is negative and decreasing it indicates bearish price momentum is increasing. If negative and increasing, then bearish price momentum is reducing.