
Pivot Points
Pivot points is a leading indicator that help traders identify support and resistant levels. It uses a period’s high, low and closing prices to calculate 3 support and 3 resistance levels for the next period, in the middle of these levels is the pivot point.
Calculating pivot points
Pivot point (P) = (high + low + close) / 3 Support 1 (S1) = (Px2) – high Support 2 (S2) = P – (high – low) Support 3 (S3) = low – 2 x (high – P) Resistance 1 (R1) = (Px2) – low Resistance 2 (R2) = P + (high-low) Resistance 3 (R3) = high + 2 x (P-low)Your chart timeframe will determine the prices used.
- For periods up to 15 minutes the previous days prices are used.
- For periods between 1 and 4 hours, the previous week’s prices are used.
- For a daily timeframe, the previous month’s price data is used.
On a chart
I find these are a lot easier to explain on a chart, where we can see all seven horizontal levels labelled for May. These would have been set using Aprils price data.
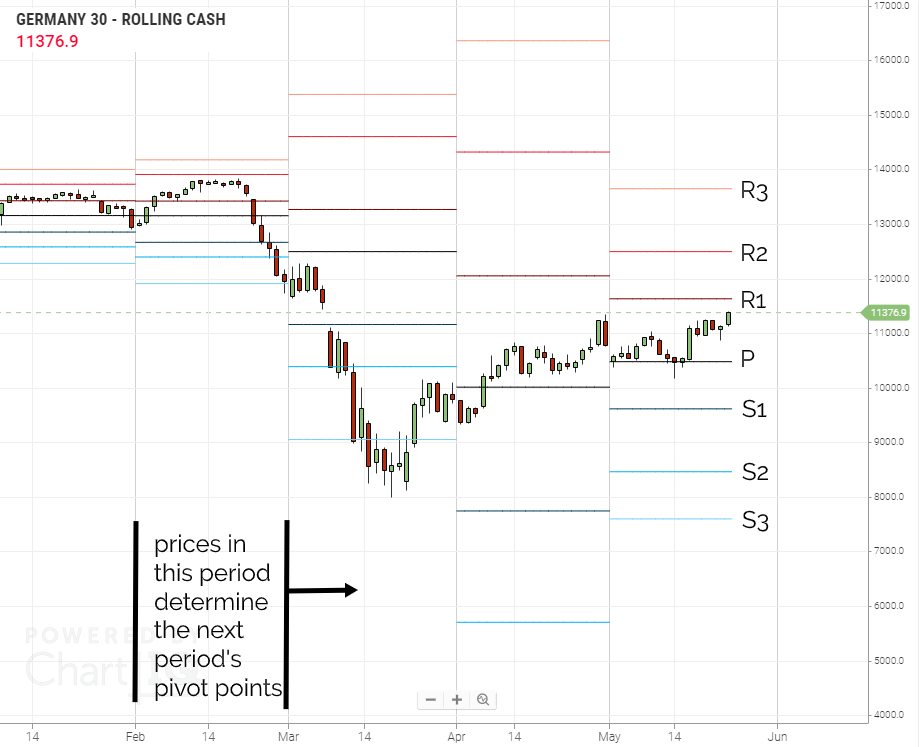
Because there was more price volatility in March the pivot point and S&R lines are a lot further apart in April (so much so we couldn’t get the S3 on the chart!).
Let’s move on and show you how traders use them.
Key Learning Points
- Pivot points is a leading indicator that help traders identify potential support and resistance areas.
- The analysis produces 3 support, 3 resistance and a pivot point horizontal line.
- These lines are calculated using the previous period’s data, so in a live period, the levels won’t change.