
Welcome, please press play to get started.
Stochastics
The Stochastics indicator is a leading oscillating indicator. It gives the trader information on the momentum of the price and is used to identify overbought and oversold situations. It does this by showing the location of the current price, relative to the high-low range over a set number of previous periods.
Calculating Stochastics
The indicator is displayed below the chart, on it there are two lines, %K and %D, plotted in line with the price periods. These are calculated as follows:
%K = (current close – lowest high)/(highest high- lowest low) x 100 %D = %K 3 period SMA%K is working out where the current price is as a percentage of the price range of the number of periods set by the traders when adding the indicator. If it is at the high its 100%, if it is at the low it’s 0%, if it’s in the middle it is 50% and so on.
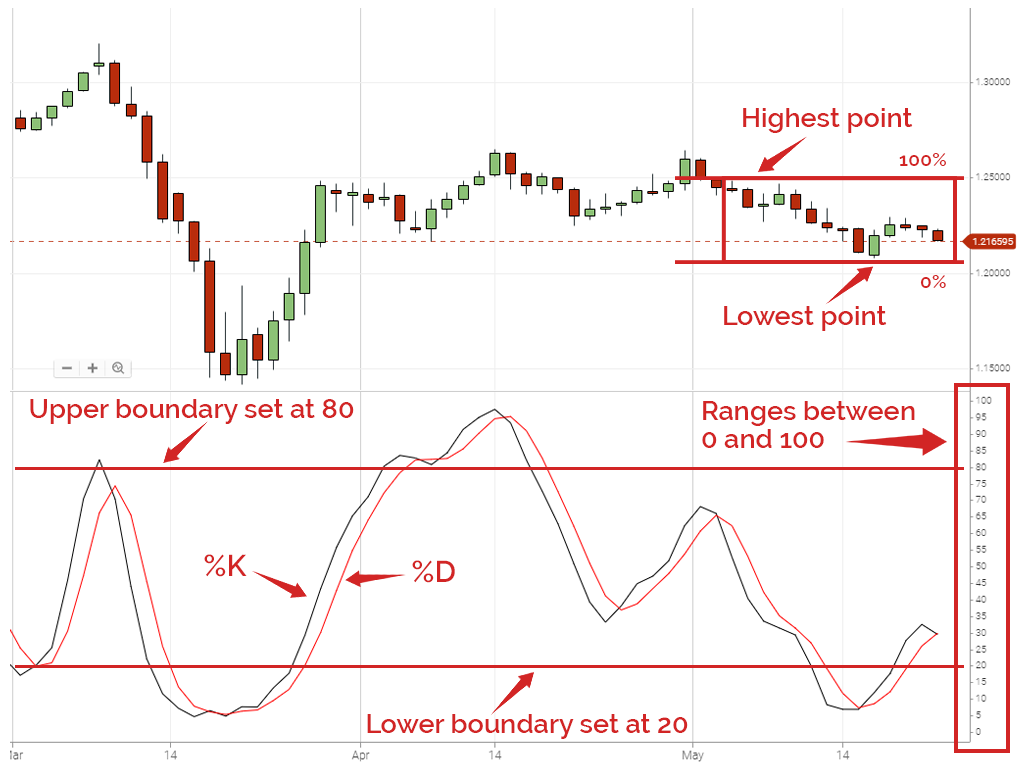
To complete the chart setup, traders can add boundaries to help with overbought/oversold analysis, typically these are set at 80% and 20%.
- Stochastics is a leading oscillating indicator.
- It measures price momentum and helps traders identify overbought and oversold situations.
- The Stochastics indicator shows the location of the current price relative to the high-low range over a set number of periods. It displays this as a percentage.
If you’re happy with everything please click ‘complete’ to move on. You will be able to come back to the lesson.