
The doji
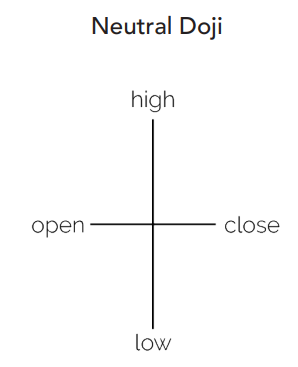
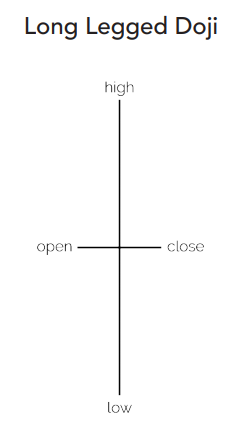
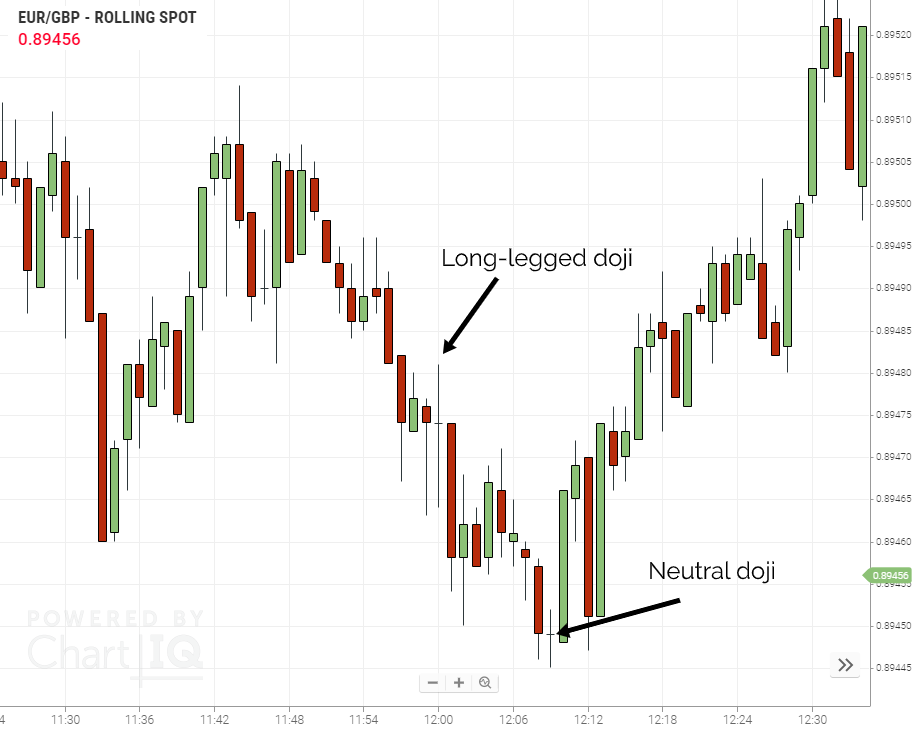
Dojis form when the opening and closing prices for a period are the same – or very similar. In neutral dojis the high and low prices are quite close together – relative to the size of candles nearby. When the high and low are quite far apart then it is a long-legged doji:
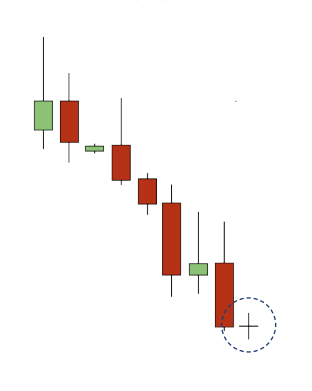
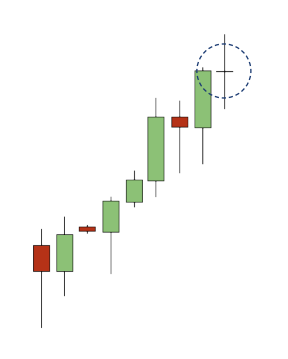
We are interested in dojis that appear in trending markets, here is a neutral doji in a down-trending market and long-legged doji in an uptrend. The direction of the trend is not an important factor.
What dojis tell traders
A doji forms if there is uncertainty in a trend.
Its an arm wrestle between bulls and bears – neither side is winning out. Neutral and long-legged doji candles in a trend suggest indecision and uncertainty.
Dojis are not signals to a trader to trade in any away – it is just telling them there is uncertainty.
Examples
Key Learning Points
- Dojis are cross-type candlestick patterns.
- For one to be valid it needs to form in a trend.
- It tells the trader there is uncertainty in the trend.