
Why use MACD
We know MACD is used to analyse price momentum but why do traders do this? Well, technical traders are trying to work out the balance between bulls and bears, if we see one side’s dominance changing significantly that is an alert that provides insight into the trend.
There are several methods to obtain insights using MACD, lets look at each of them.
MACD signal line crossovers
The signal line is a 9 period EMA of the MACD line. When the MACD line crosses the signal line it can alert a trader to a possible turning point in price momentum. This is useful because we want to get a heads up if a trend is changing – or is about to change.
A bullish crossover is when the MACD line crosses up over the signal line, a bearish crossover is when the MACD line crosses down over the signal line.
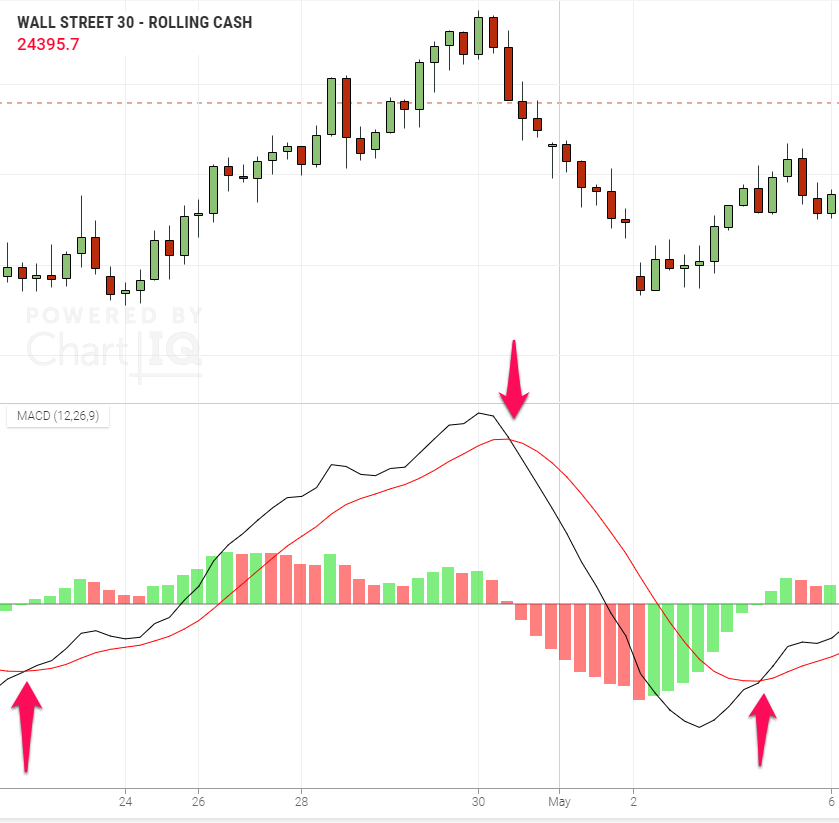
Crossovers, where the MACD line is either extremely high or low, should be traded carefully as they can be misinterpreted.
Centerline crossovers
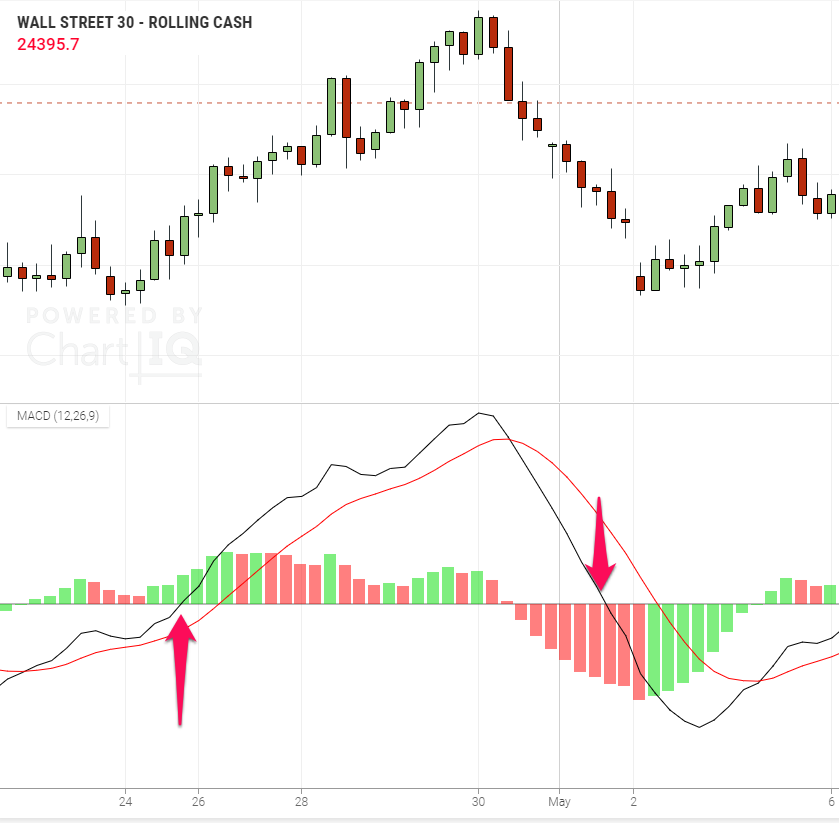
This is when the MACD line crosses over the centreline. A bullish crossover is when it goes from negative to positive, crossing up over the centerline. A bearish crossover is from positive to negative, crossing down over the centerline. This is used by traders, as part of a range of checks, to help confirm a trend.
MACD divergence with price
Divergence occurs when the MACD line’s highs and lows don’t correspond with the highs and lows in price. If the price is rising but momentum falling then technical traders interpret this as an alert that the bullish trend might be losing steam. Conversely, if the price is falling but momentum is easing then this also might suggest the bears are losing steam.
The limitations of MACD
- Remember, MACD is a lagging indicator and it is late to the party sometimes.
- While it oscillates it is not relative and therefore does not have any upper or lower bounds – in short, we don’t really know what the overextended conditions look like.
- There are three popular ways of interpreting MACD.
- Signal line crossovers indicate possible turning points in momentum.
- Centerline crosses tell the trader if momentum has turned bullish from bearish or vice versa.
- The divergence between the price and MACD might suggest trends are running out of steam.
- The limitations of MACD is that its a lagging indicator and it does not have upper and lower bands.