
Sentiment
There are two ways traders use pivot points. First, pivot points are used to assess the broad sentiment of a period. If the price is above the pivot line then it suggests bullish bias and strength. If below then bearish bias and weakness.
Support and resistance
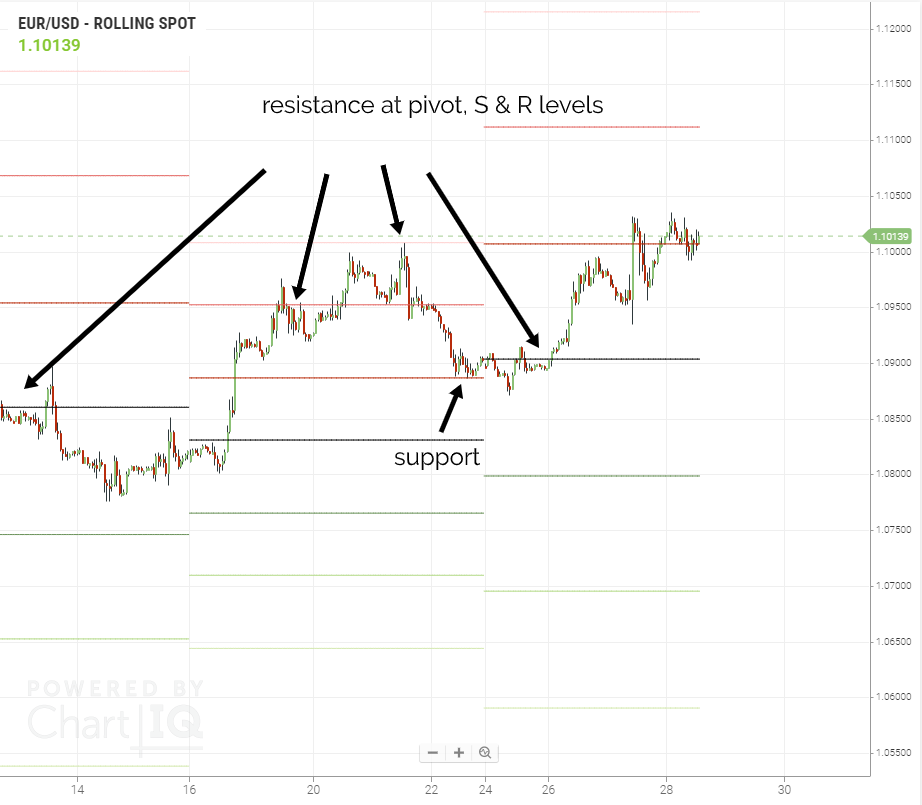
However, the main use is as a leading indicator to establish potential areas of support and resistance in the coming period.
In this chart of EUR/USD we can see the pivot level and the combinations of the S and R levels provide significant support and resistance at various stages. It is not enough to justify a trade by itself but it certainly alerts us to the changes in participant psychology that might be going on.
Limitations
Like other indicators, it comes with some limitations.
- The pivot point calculations are based on price data that can be significantly out of date. When we look at a daily chart the pivot points are based on the previous month’s data meaning this could be out of date by up to 60 days!
- Pivot points only use three inputs, the close, the high and the low of the previous period, so it can be a bit simplistic.
The way we think pivot points should be used is as a support and resistance tool, to add towards the evidence you’re building for a trade, but not by itself, independent of any other analysis.
Key Learning Points
- Pivot points can be used to assess the broad sentiment of the period, above P and its bullish, below and it is bearish.
- The main use of Pivot points is to establish potential areas of support and resistance in the coming period.
- Pivot points like many indicators have limitations, the price data can get out of date and it relies on just three numbers.