
Using RSI
RSI alerts traders to changes in momentum and potential trend reversals. It can also be used to confirm the trend.
Oversold and overbought
RSI suggests markets are overbought when it tracks into the zone above 70 and oversold when it falls below 30. Remember, when an oscillator is overbought traders believe its an opportunity to go short and when it is oversold to go long. While RSI is definitely a more nuanced indicator than Stochastics, it is still just a momentum indicator and when a trend sets in can suggest a market is overbought or oversold for long periods of time.
Divergences
As with Stochastics, RSI probably provides its most useful insight when it diverges from price.
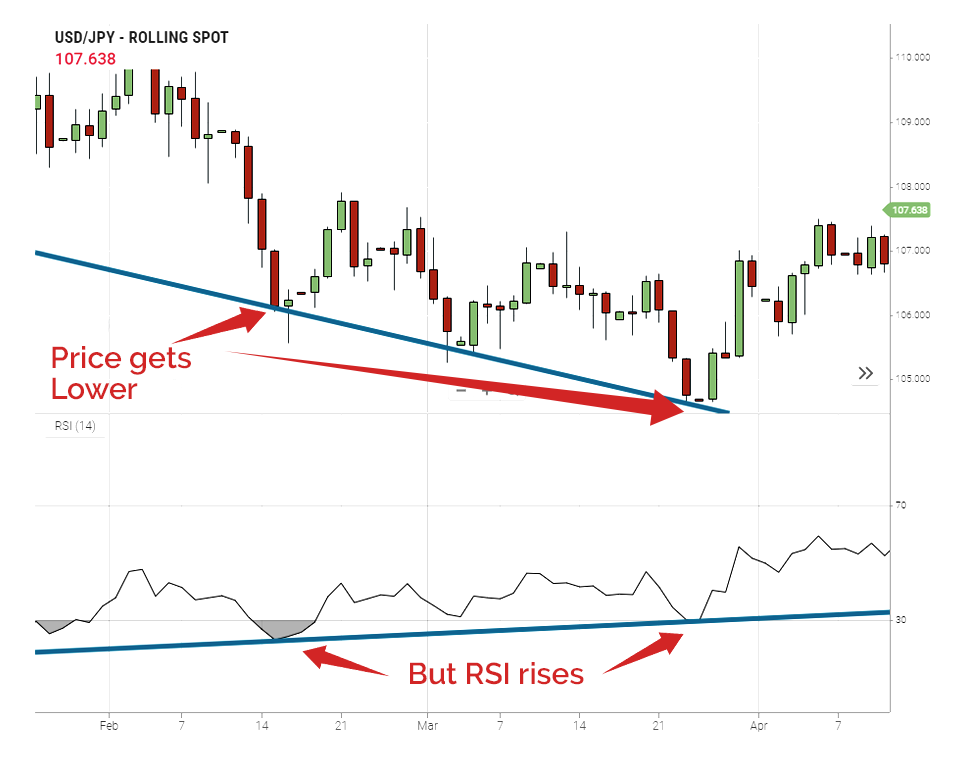
Here, we can see the price of USD/JPY continuing to fall but RSI is rising. This suggests momentum in that particular bearish trend is reducing – the bears are running out of steam.
RSI trendlines
Traders can conduct technical analysis on the result of the indicators itself.
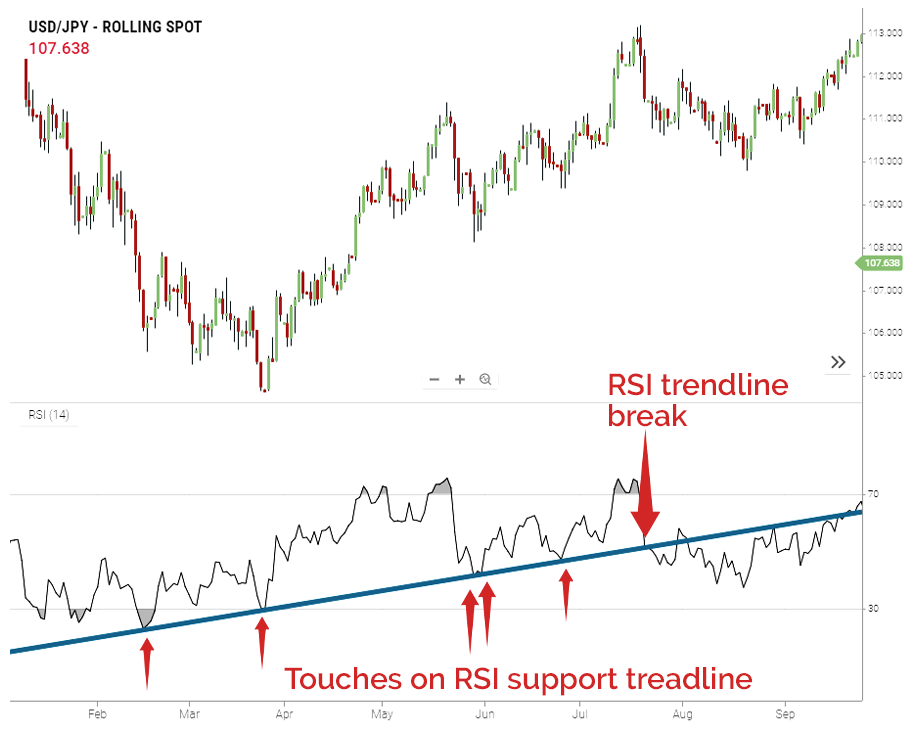
What we’re seeing here is 5 touches on an RSI support trendline, when it breaks it is telling us the growing support for increasing momentum has broken, alerting us to a change between bulls and bears. You can see after it broke, the bullish trend building from March through to July fizzled out in August and September – may be the bulls went on holiday, but the point is RSI told us they were going. This is a good example of a leading indicator preceding the outcome.
This analysis is also possible with RSI resistance trendlines.
Trend identification
RSI helps us confirm the trend. By definition, for a trend to develop it needs strength in momentum. In an uptrend, RSI fluctuates between 40 and 90, in a downtrend between 10 and 60. There are better methods for identifying the trend initially but this piece of analysis should be added as another layer of evidence.
RSI centerline crossovers
These are simply when the RSI crosses over its centerline – 50. If RSI crosses up over 50 some traders consider this a trigger to buy, when RSI down below 50 its a trigger to sell. While we don’t use this method, it is worth knowing it exists because others are doing it.
Failure swings
Bullish failure swings are when RSI crosses below 30, tracks back above but fails to cross back at its next low. These are a sign the momentum of the bears is waning. Bearish failure swings are the inverse, using the RSI 70 level as the threshold.


Limitations
- Like all momentum indicators in long trends, the RSI line can show overbought or oversold for long periods of time, this may lead to false signals.
- Some of the popular RSI analysis techniques we’ve introduced just concentrate on the RSI figure, and not price. I’m sceptical when derivatives of price are absolute triggers for trades. Always remember to trade the price action and not the indicator.
- RSI is a leading indicator, this means it was designed to lead the price action.
- RSI helps traders analyse momentum and confirm the trend.
- Like other leading indicators RSI can be used to spot trend reversals.
- One of the most insightful analysis techniques using RSI is to look for divergences against price.
- Like all momentum indicators, RSI can stay overbought and oversold for long periods of time as the trend plays out.
- There are other techniques, like RSI centerline crossovers and failure swings.
- Always remember to trade the price action and not the indicator.
- On balance, RSI is probably the best indicator to use to analyse momentum.