
Welcome, let’s get started, please press play:
What is technical analysis
Technical analysis is the study of market activity, to help inform opinion on future price movements – i.e. trends. Traders do this via techniques like candlestick analysis, price pattern analysis, technical indicators, market stage analysis, support & resistance and so on. We cover all this in our courses.
Contrasted to fundamental analysis
It might be worth contrasting technical analysis with the other type of popular analysis: fundamental.
| Technical analysis | Fundamental analysis | |
| Methodology | Used for forecasting the direction of prices through the study of past market data, primarily price and volume. | Used to asses the underlying risk factors impacting the value of an asset. |
| Data from | Charts, price and volume data | Economic announcements, company data, news |
| Style | Trader | Investor |
| Time horizon | Short to medium | Medium to long |
| Trades when | Trend identified | Price is significantly different to value |
Fundamental analysis differentiates between price, which is what you pay, and value, which is what you get.
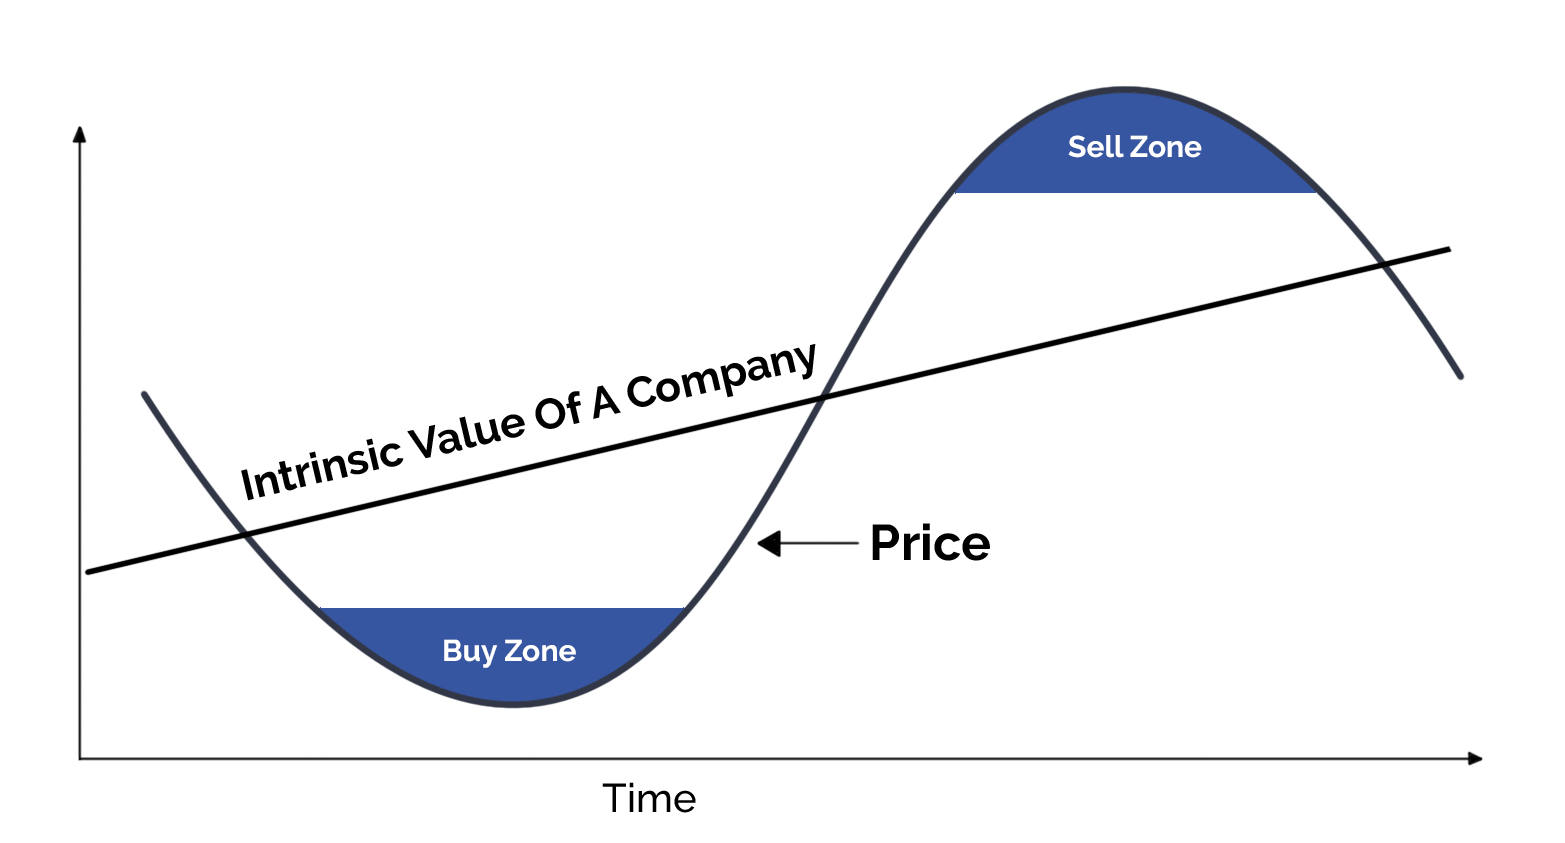
Through fundamental analysis, the analyst is assessing the value of an asset – if the price is materially different then that creates a trading opportunity. The investment decision is based on the assumption that price will eventually return to the value of an asset. The problem is it is difficult to work out when this will happen, the difference between price and value might remain for a long period of time, or it might even widen further. This is why this method tends to be used by investors, with cash investments. Unlike margin trading, cash investments don’t use leverage, don’t need funding and can, therefore, be held for long periods of time without much cost.
There are two types of fundamental analysis:
Which is the best?
Within each broad analysis method, there are different techniques like candlestick or price pattern analysis – so which one is the best? There is no right answer here, and we’ll help you answer this for yourself over the next couple of lessons. The key point to note at this stage is:
- Technical analysis is the study of market activity. Traders do this to form an opinion on future price movements.
- Fundamental analysis seeks to assess the factors that impact an asset’s value.
- Technical analysis works out the ‘when’, fundamental analysis works out the ‘why’.