Why Stop Loss Trading is So Important (And Strategies to Use)
If I would need to list only one trading tool that is absolutely necessary to a trader’s success, it would be stop-losses. Without them, you shouldn’t even think about trading. If you’re serious about your trading career, you need to use stop-losses in every single trade that you’re taking.
Now that you know how important they are, it’s time to shed some more light on stop-loss orders, explain why you need to use them, describe the main types of stop-losses and show you how to incorporate them into your trading strategy.
It’s not enough to be aware of their existence and to place them at arbitrary levels. Depending on how you use them, stop-losses can make or break a trader.
- Learn more, take our premium course: Trading for Beginners
What is a Stop Loss?
A stop-loss order is an order that automatically closes a losing position once the price hits the pre-specified level.
Let’s say you’re trading stock XY and you buy the stock at $50. You don’t want to hold the stock if the price falls to $45, so want to sell it and close your position at that level.
There are two ways to do it: You can either follow the price and close the trade manually as soon as the price falls to $45, which is a so-called “mental stop”, or you could simply place a stop-loss level at $45 which automatically closes your trade when the price reaches your order.
In most cases, it’s a better option to place a stop-loss order than to have a “mental stop.” Stop-loss orders never sleep, they always follow the market and will close your trade almost guaranteed at the pre-specified price, preventing heavy losses on a losing position.
Basically, when the price reaches the level pre-specified in a stop-loss order, the order becomes a buy market order when used with a short position, and a sell market order when used with a long position.
Why Should You Use Stop-Losses?
Stop-losses prevent large and uncontrollable losses in volatile trades. If you’re not using stop-losses, it’s only a matter of time when a large losing position will get out of control and wipe out most of your trading profits, eventually even your entire account!
If you’re serious about staying in the game in the long run and growing your trading account, it’s necessary to use stop-loss orders in every single trade you’re taking. That’s the first rule of this article – Always use stop-losses!
Stop-losses also play a major role in risk management. Depending on their stop-loss, traders are calculating what position size to take, how much money to risk on a single trade, how much they’re risking on any single dollar they’re making, and much more.
We’ll go in much more detail on how to incorporate stop-losses into your trading strategy later in this article. Now, let’s go through the main types of stop-loss orders you need to be aware of.
Read:
What are the Best Combinations of Forex Indicators for Day Trading?
A Lowdown on Forex Robots (And the Inner Workings of Them)
Super Swing Trading Strategies That Actually Work
Types of Stop Losses
While a stop-loss order is always a stop-loss order, they differ in the way how traders are using them. Depending on how traders identify potential stop-loss levels, there are four main types of stop-losses – charts stops, volatility stops, time stops, and percentage stops.
Chart Stop
Chart stops are arguably the most popular way to use stop-loss orders. They are based on important technical levels on the chart, such as support and resistance zones, trendlines, Fibonaccis, Elliott Wave levels, and chart patterns, to name a few.
A trader who is looking to go long would place a chart stop just below an important technical level. The idea behind this approach is that important levels in a chart hold an increased number of buy orders as market participants who’ve missed the initial move want to enter the market at a more favourable price.
By placing a stop-loss just below that level (such as in the case of horizontal support levels), a position will be automatically closed if that level breaks. Similarly, traders who want to go short would place a chart stop just above an important technical level. Resistance zones are expected to hold an increased number of sell orders which can reverse the price.
If an important resistance level gets broken, a trader doesn’t want to stay inside a short position anyways, and the stop-loss order will automatically close his or her trade. Chart stops usually return the best results among all other stop-loss types, which is why you should look to adopt them too in your trading strategy.
Read:
Forex Trading Terminology: 15 Must Know Terms
26 Quickfire Tips to Become a Successful Forex Trader
Revealed: How to Make Money Day Trading
Volatility Stop
Unlike chart stops, volatility stops are based on the volatility of the financial instrument you’re looking to trade. Volatility refers to the amount of price-change over a given period of time. A volatile market has large price-changes in relatively short periods of time, while the absence of volatility means that the market doesn’t move at all.
Although volatility can also increase risk, there are no trading opportunities in a market that isn’t volatile.
Volatility stops look at the volatility of a financial instrument to base your stop-loss level on. There are two popular ways that traders use volatility for stop-loss decisions:
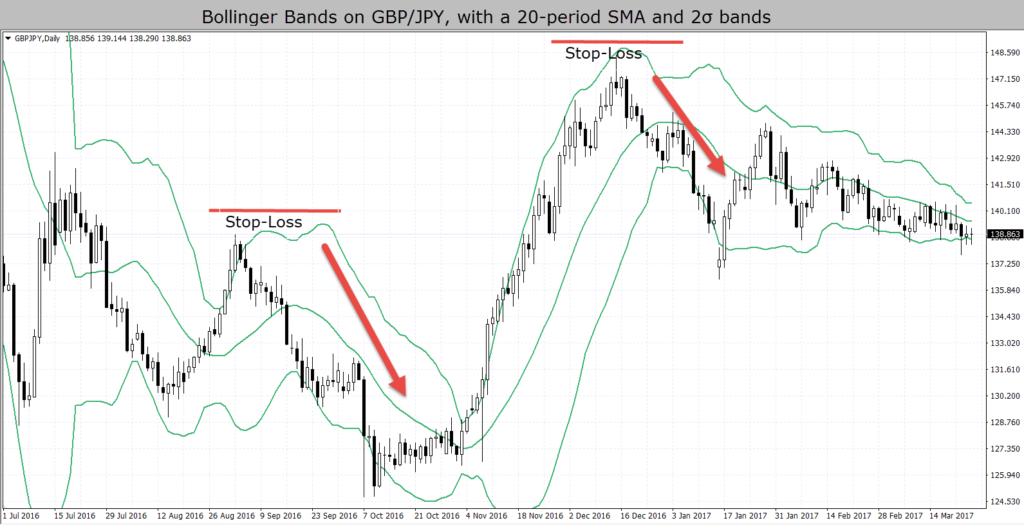
- Bollinger Bands – Bollinger Bands are a technical indicator that is often used to measure how volatile a market is. It consists of three lines – the middle line is a moving average, and the two additional lines are plotted two standard deviations above and below the moving average.
When volatility picks up, Bollinger Bands widen, and when volatility slows down, Bollinger Bands contract. Traders who are using volatility stops can look to place their stops just outside the Bands.
- Average True Range – Another popular technical indicator that can be used for placing volatility stops is the Average True Range indicator. The ATR measures the average range of a financial instrument’s price over a given period of time.
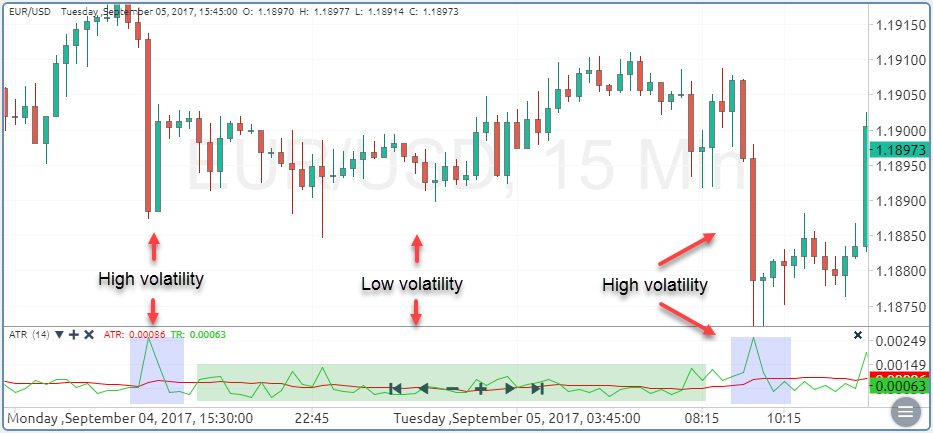
Traders can use the ATR reading to set their stop-loss outside the average range, making sure that they don’t get stopped out by simple market noise.
- Learn more, take our free course: Bollinger Bands: Fast Track
- Learn more, take our free course: How to Use Technical Indicators
Read: A Day in the Life of a Day Trader
Time Stop
As their name suggests, time stops refer to closing a trade after a pre-specified period of time. For example, a trader who is day trading the market could close all of his open trades after the end of the trading day, while swing traders who don’t want to hold their trades over the weekend could simply close all trades by the end of the Friday trading session.
Time stops are best combined with other types of stop-loss levels. If your trade is still active by the end of the trading day or ahead of the weekend, you could look to close it manually in that case.
Percentage Stop
Finally, percentage stops are based on a percentage of your trading account to limit the total risk of a trade. For example, a trader with a $10,000 account who wants to risk 3% of his trading account on a single trade could place a stop-loss at a level that ensures his total potential loss is $300.
Some traders might think that percentage stops are a good way to manage and limit losses in the market. However, bear in mind that percentage stops imply placing a stop-loss at an arbitrary level, as long as the total potential loss doesn’t exceed a percentage of the trading account.
Much better results can be achieved by combining chart stops with percentage stops, i.e. a trader would place a stop-loss based on an important technical level and manage his total risk by adjusting the position size of the trade. We’ll show you how to do exactly that later in this article.
Trailing Stops
Besides the four types of stop-loss orders mentioned above, there’s also a special type of stop-loss called trailing stops.
Trailing stops automatically move the underlying stop-loss level with each tick of the price that goes in your favour. However, if the price reverses and starts to go against you, a trailing stop will stay at its most recent level, limiting your losses or locking in unrealised profits.
Stop-Losses and Trading Strategies
Stop-losses play an integral part in any well-round trading plan and risk management. Here’re a few tips on how to incorporate stop-loss in your daily trading routine to maximise profits while simultaneously reducing risks.
Place stop losses at important support & resistance zones
If you’ve followed carefully, you know that we’re talking about chart stops here. Among all other stop-loss types (except trailing stops), chart stops are the most effective way to use stop-loss orders in your trading.
To use chart stops, first you need to identify important technical levels – usually support and resistance zones – in the chart. After that, place your stop-loss a few pips above an important resistance level (in case you’re planning to go short), or a few pips below an important support level (in case you’re going long.)
When we talk about support and resistance levels, bear in mind that they can come in a variety of formats. Besides horizontal support and resistance levels, you can also use trendlines, channels, Fibonaccis, pivots, or any other technical tool you want.
The key here is to place stop-losses above/below those levels and not exactly on them. Otherwise, fake breakouts could trigger your stops and leave you with a loss.
Use trailing stops in trend-following strategies
Trailing stops are stop-loss orders that automatically trail the price with each tick that it goes in your favour. That’s why they’re especially popular among trend-following traders.
To use a trailing stop with a trend-following strategy, measure the average distance between the higher low and higher high (in uptrends) and lower highs and lower lows (in downtrends.) This allows you to set a trailing stop with a distance of the average correction move of a trend.
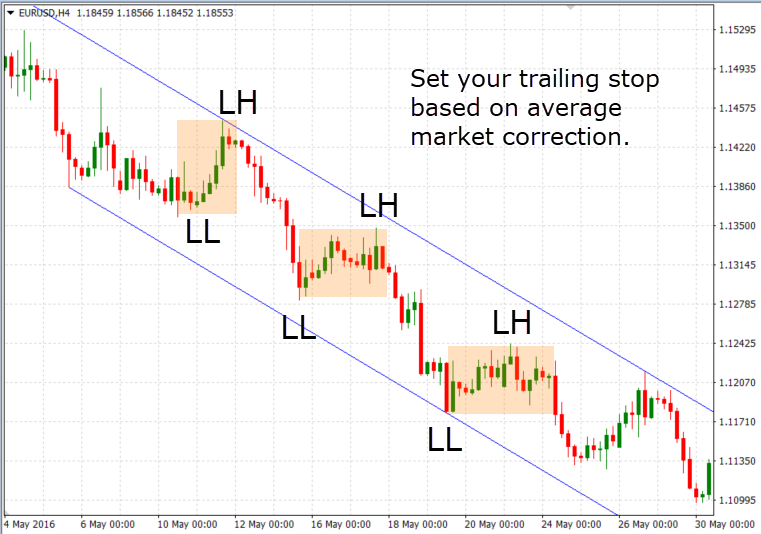
This way, you’ll stay inside a trend as long as possible (until the trend reverses) and the trailing stop will automatically lock-in profits on the way!
Move your stop-losses to lock-in profits
Another popular risk management technique is to lock in unrealised profits by moving your stop-loss level in a profitable trade. Notice that the result of this technique is similar to using a trailing stop, with the important difference that you have to move your stop-loss manually.
This has both its advantages and disadvantages. For example, moving your stop-loss manually gives you more control over the timing of your move, but you may give back some unrealised profits if the price reverses before you move your SL.
Traders who use this technique usually follow a percentage system, i.e. they move their stop-loss to breakeven once the profits hit 33% of the TP, move the stop-loss to 33% of TP once the profit hits 66% of TP, etc.
Calculate your position size based on your stop-loss
Position sizing deserves a special place in your risk management and trading plan for a reason. It’s the most common mistake that beginners make in their early trading journey, and without position sizing, there is a large chance you’ll blow your account.
Position sizing refers to calculating your position relative to the risk you’re taking, and stop-losses play an important role in this.
Let’s say you place your stop-loss 50 pips away from the entry price, based on an important support or resistance level (chart stop.) If you want to risk only 2% of a $10,000 trading account, which equals to $200, you would need to trade a position size that returns a pip-value of $4 ($200 / 50 pips). This means that each pip the price moves in your favour, your profits rise by $4, and vice-versa.
As a rule of thumb, one standard lot (100,000 units of the base currency) have a pip-value of $10. So in our example, you would want to open a position size of 0.40 lots. Since each currency pair has different pip-values, most popular trading platforms allow you to fine-tune your position size to meet your desired pip-value.
Your profit target should be wider than your stop-loss
Successful traders always expect to make a larger profit than their potential loss. In other words, they risk $1 to make a potential profit of $2, $3, or even $5. This is called the reward-to-risk ratio of a trade.
For example, if you place both your stop-loss and take-profit levels 50 pips away from the entry price, that trade would have a reward-to-risk ratio of 1, i.e. you’re risking $1 to make $1. Over the long run, this could have a negative impact on your trading performance, as would need to have a success rate of more than 50% to make a profit.
Now, let’s say your stop-loss is 50 pips and your take profit is 200 pips. This gives you reward-to-risk ratio of 4:1, i.e. you’re risking $1 to make $4. With this approach, you can have a success rate that is significantly under 50% and still make a hefty profit in the market.
Naturally, just like stop-loss orders, take-profit orders should also be based on important technical levels. Place your take-profits a few pips below an important resistance (when going long), and a few pips above an important support (when going short), because you don’t want the price to reverse before your take-profit gets triggered.
Final Words
Stop-loss orders can play a major role in your trading, risk management, and performance. They’re an integral part of any serious risk management and trading plan and can be successfully incorporated in almost any kind of trading strategy.