How to Identify and Draw Support and Resistance Levels on Any Chart

Support and resistance levels are a powerful concept in technical analysis.
Many technical tools have been developed to take advantage of support and resistance levels in the market. This makes them one of the most wide-spread trading strategies when trading the financial markets.
If you’re a beginner in the market, understanding the concept of support and resistance levels should be your number one priority. This is because many advanced strategies rely on the basics of support and resistance.
Let’s get started right now …
- Learn more, take our premium course: Trading for Beginners
What is Support and Resistance?
Support lines represent prices where the market had difficulties to break below.
This signals that the same price-levels could again represent an obstacle for the price to move lower. Usually, there is a high number of buy orders located just around important support levels. When these are executed it can cause the price to bounce off the support level. In other words, buyers jump into the market when the price approaches important support prices.
Resistance levels are similar to support levels, only that they represent price-levels at which the price had difficulties to break above. This signals that the same level could again act as a resistance, or barrier, for the price to move higher. While buy orders are located around important support levels, sell orders are clustered around important resistance levels.
Simply put, sellers jump into the market when the price reaches towards an important resistance level.
Many tools in technical analysis have the purpose to identify important support and resistance levels where the price could retrace. Some of those tools include horizontal lines, trendlines, channels, chart patterns and Fibonacci tools. There is even a complete trading style developed around the breakout of support and resistance levels, which is popular among retail Forex traders.
Read:
Types of Support and Resistance Lines
There are many types of support and resistance lines in the market. They differ by the way how they form. The list below shows some of the most important levels that every trader should know about.
| Horizontal S&R Levels | Drawn by horizontal lines using at least one price-point |
| Round-Number S&R Levels | Psychological S&R levels around round exchange rates (e.g. 1.00, 1.10, 1.50 etc.) |
| Trendline S&R Levels | Drawn by upward or downward sloping trendlines using at least two price-points |
| Fibonacci S&R Levels | S&R levels based on Fibonacci ratios, used to identify the end of a price-correction |
| Dynamic S&R Levels | S&R levels which update with each new price-tick |
1) Horizontal Support and Resistance Levels
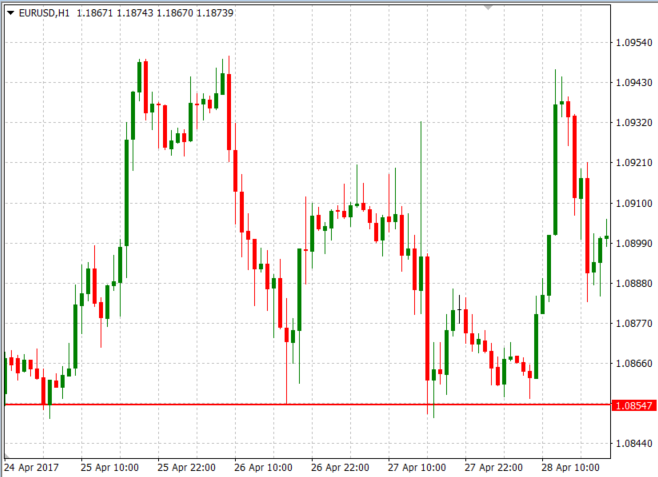
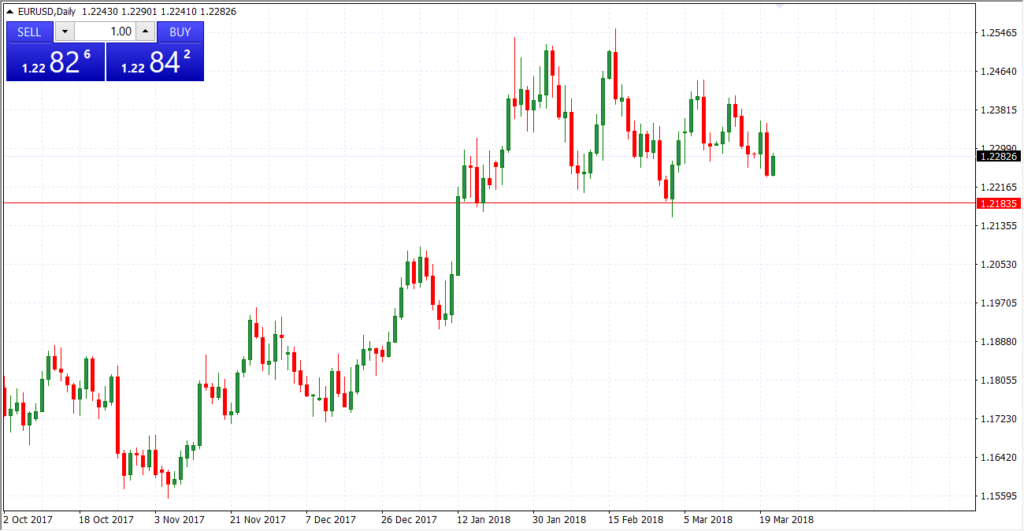
Horizontal support and resistance levels are the most basic type of these levels. They’re simply identified by a horizontal line. First, you need to spot a past price-level where the price had difficulties to break above or below. Then mark it with a horizontal line which rays into the future. Once the price approaches this horizontal line again, there is a high chance that the price will retrace from that line.
The following charts show horizontal support and resistance levels in play.
Support Level:
Resistance Level:
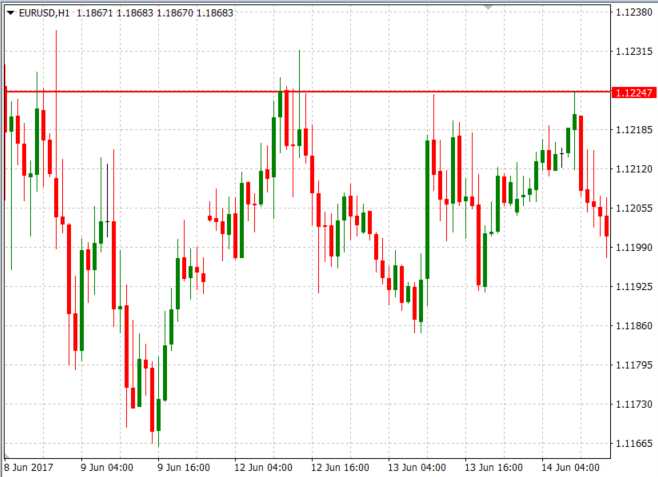
Did You Know? For a support or resistance level to be important, the price should touch the level at least three times.
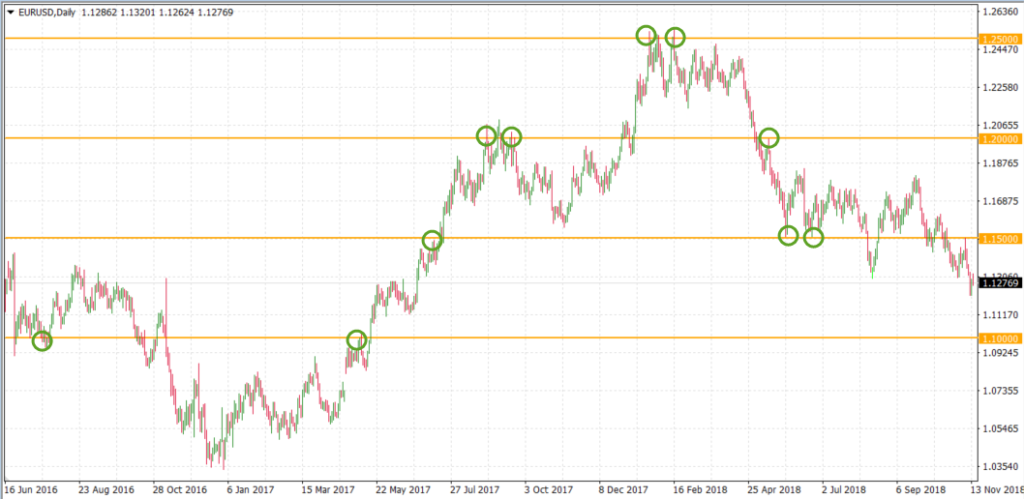
2) Round-Number Support and Resistance Levels
Another type of support and resistance levels are round-number levels, they form around round-number exchange rates. These support and resistance levels are psychological levels. As market participants tend to put their stop levels or profit-targets around round-numbers, increasing the number of market orders around those levels.
Round-number support and resistance levels are horizontal lines drawn at round-number exchange rates, such as 1.00, 1.10, 1.20, 1.25 etc. The following chart shows the EUR/USD pair with each round number acting as a line of resistance and support.
Read: What are Key Chart Levels? (And How to Trade Them)
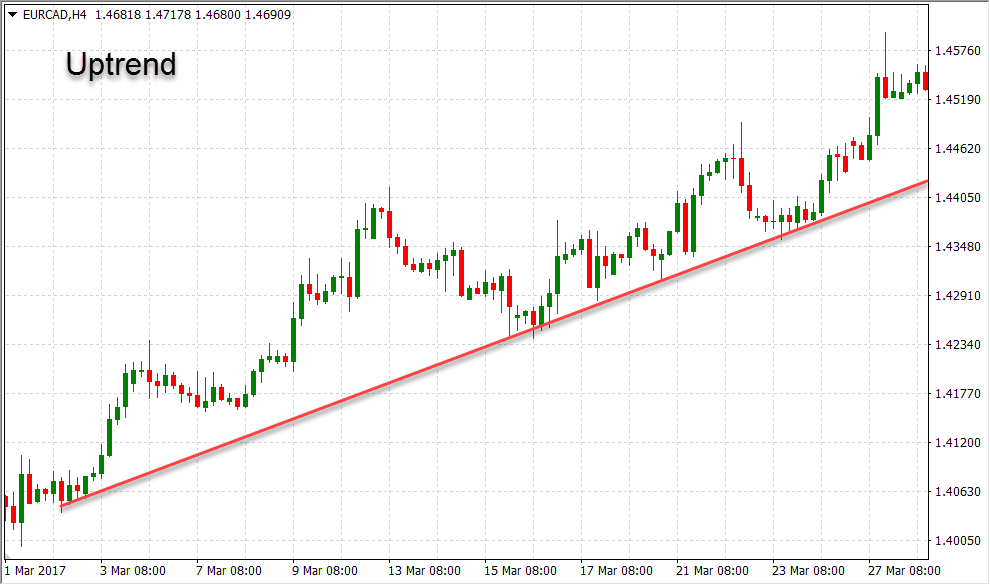
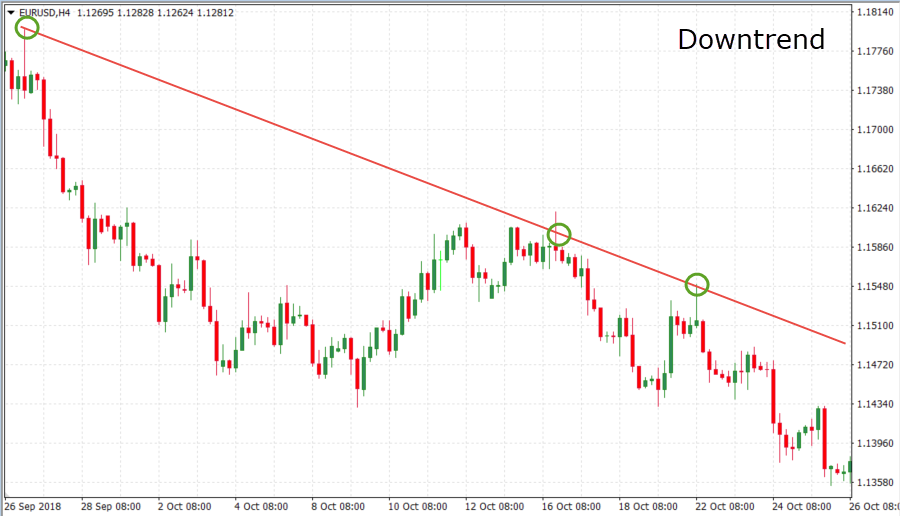
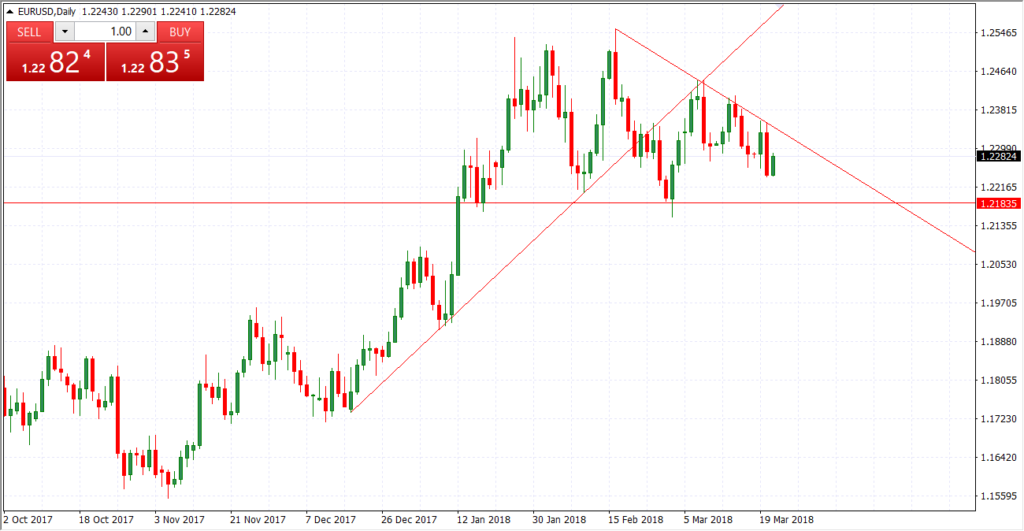
3) Trendline Support and Resistance Levels
Trendline support and resistance levels are not drawn by horizontal lines, but by trendlines which can be upward sloping or downward sloping. Since the Forex market likes to trend, trendlines are often used to identify uptrends and downtrends.
Each time the price approaches towards a trendline, there is a high chance that the price will bounce off the trendline. Just like with horizontal support and resistance levels, the trendline should have at least three price-touches before it is considered important.
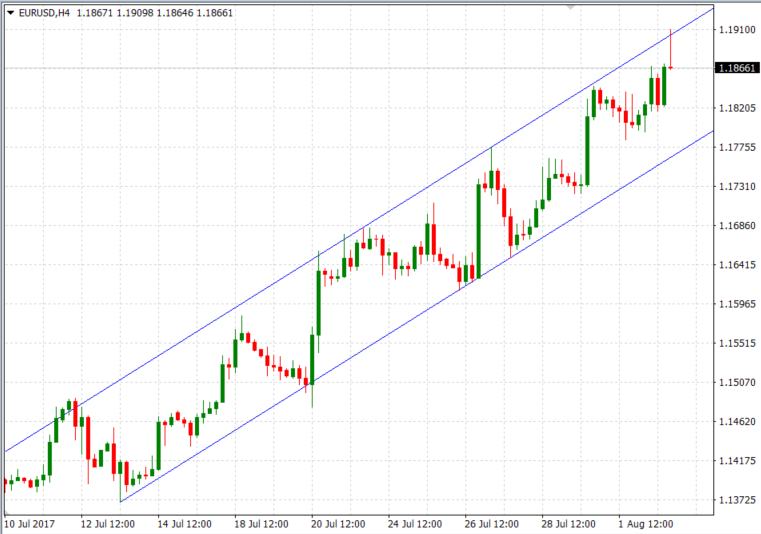
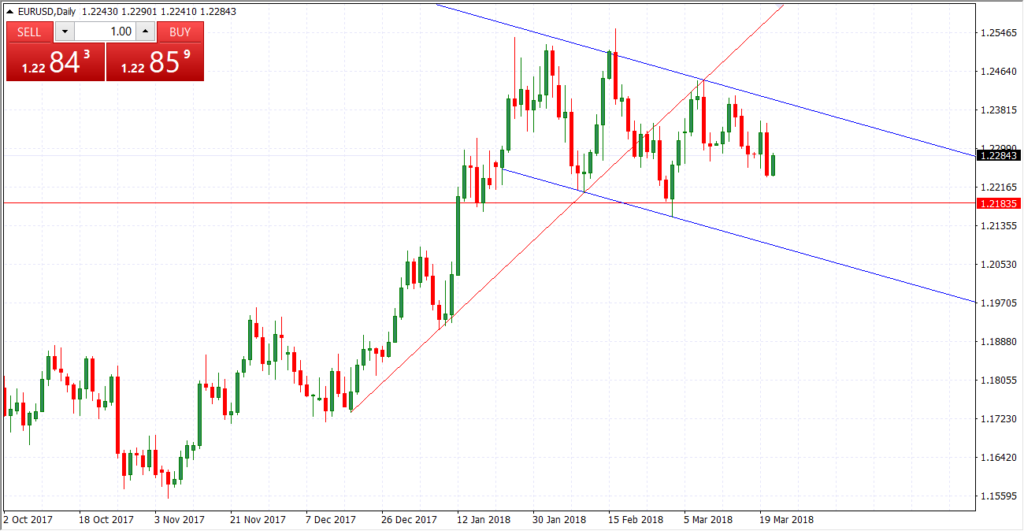
Similar to trendlines, channels can also be used to identify support and resistance levels. A channel provides both support and resistance for the price by its lower channel line and upper channel line, respectively. The following chart shows a support and resistance chart based on a rising channel.
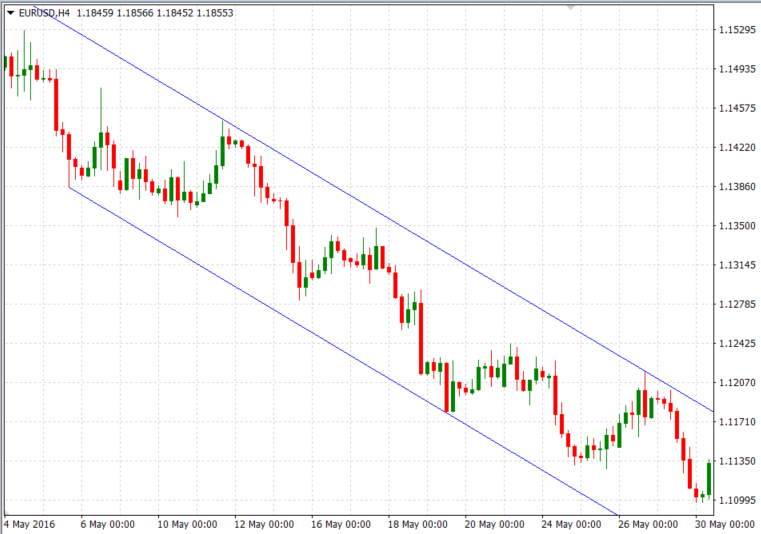
The next chart shows a falling channel acting as support and resistance for the price.
- Take our free course: Technical Analysis Explained
- Take our free course: Trends, Support & Resistance
- Take our free course: Japanese Candlesticks Decoded
- Take our free course: Reversal Price Patterns
- Take our free course: Continuation Price Patterns
- Take our premium course: Trading for Beginners
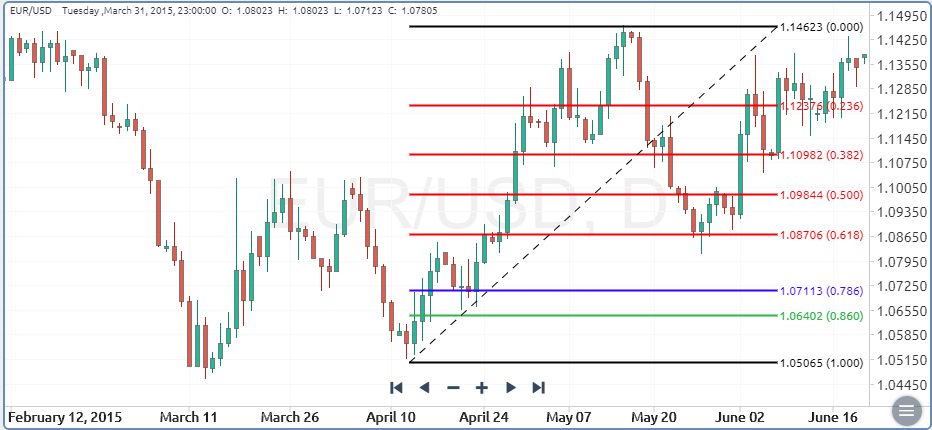
4) Fibonacci Support and Resistance Levels
The Fibonacci retracement tool is an extremely popular tool used to identify price-levels where a price correction might end. This leads to the continuation of the underlying trend. Price corrections are counter-trend price moves during uptrend and downtrends which give price-charts their characteristic zig-zag pattern.
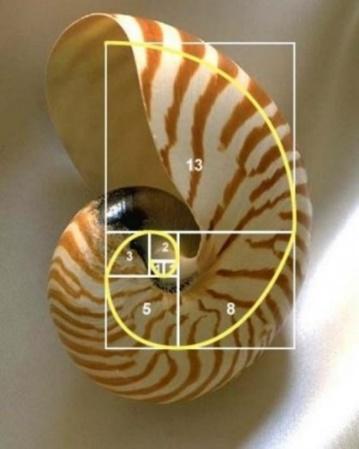
Leonardo Fibonacci was a famous Italian mathematician from the Middle Ages, known for the Fibonacci sequence of numbers which goes like this: 1,1,2,3,5,8,13,21,34… If you divide any number in the sequence with its successor, you’ll always get the same result: 0.618. This ratio, also known as the Golden Ratio, is quite common in nature and occurs naturally even in the human body.
Market participants believe that the Golden Ratio can be used to measure the extend of price corrections in the market. The 61.8% Fibonacci retracement is believed to provide important support for the price. In any case, practice shows the market tends to respect the 61.8% Fib retracement, including other variations of Fibonacci ratios. The following chart shows an example of how Fibonacci retracement levels are used to identify support levels.
- Learn more, take our free course: Fibonacci: Fast-Track
5) Dynamic Support and Resistance Levels
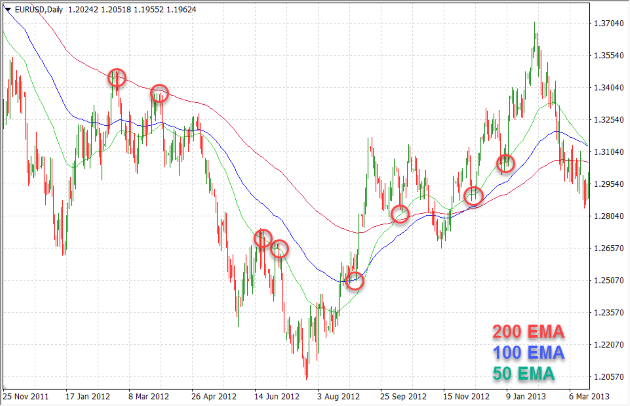
As their name implies, dynamic support and resistance levels change their level with each new price-tick. To draw dynamic support and resistance levels, traders usually use moving averages which are automatically drawn by your trading platform. The 200-day exponential moving average (EMA), 100-day EMA and 50-day EMA are very popular dynamic support and resistance levels.
This is followed by a large number of traders which increases their importance and self-fulfilling prophecy even more. Dynamic support and resistance levels are shown on the following chart.
How to Draw Support and Resistance Lines
To draw horizontal support and resistance lines, we need to have at least one price-point at which to place our horizontal line. That price-point is usually identified as an obvious swing high or swing low where the price previously retraced.
Trendline support and resistance lines need to have at least two price-point to be drawn. Simply connect two swing highs or two swing lows in a price-chart with a trendline, and project the trendline into the future. However, bear in mind that in both cases (horizontal and trendline S&R lines), the lines become more important if the price touches them at least three times.
Daily Forex Support and Resistance Levels
Support and resistance levels on higher timeframes have greater importance than support and resistance levels on lower timeframes. The daily timeframe is especially popular to draw S&R levels, as many traders follow and base their trading decision on the daily timeframe.
Remember that S&R levels have a high degree of self-fulfilling prophecy, which means that more obvious levels tend to work better as a support or resistance for the price than less obvious levels on very short timeframes.
How to Draw Support and Resistance Lines in MT4
MetaTrader 4 is one of the most popular trading platforms among retail Forex traders which features advanced charting tools to identify important market turning points. Let’s take a look at how to draw support and resistance lines in MetaTrader 4.
Drawing Horizontal Lines
To draw a horizontal line on your chart, select the horizontal line button on your Toolbar and click anywhere on the chart where you want the line to appear.

Horizontal lines are often used to mark support and resistance levels in the market, where the price might have difficulties to break below/above. The following picture shows a horizontal line drawn on the EUR/USD pair, where the price might find support.
Drawing Trendlines
Another popular tool for chart analysis are trendlines. They are similar to horizontal lines, only that they slope up or down and are not necessarily horizontal. Trendlines are used to analyze the current market trend. To draw a trendline on your chart, select the trendline button in your Toolbar.

Drawing Channels
Channels are similar to trendlines, only that they include a second trendline which is drawn parallel to the first trendline. Again, channels are used to gauge the current trend with the upper and lower channel lines acting as support and resistance lines.
A trend channel (blue) drawn on the EUR/USD pair is shown on the following chart.
Drawing Fibonacci Retracements
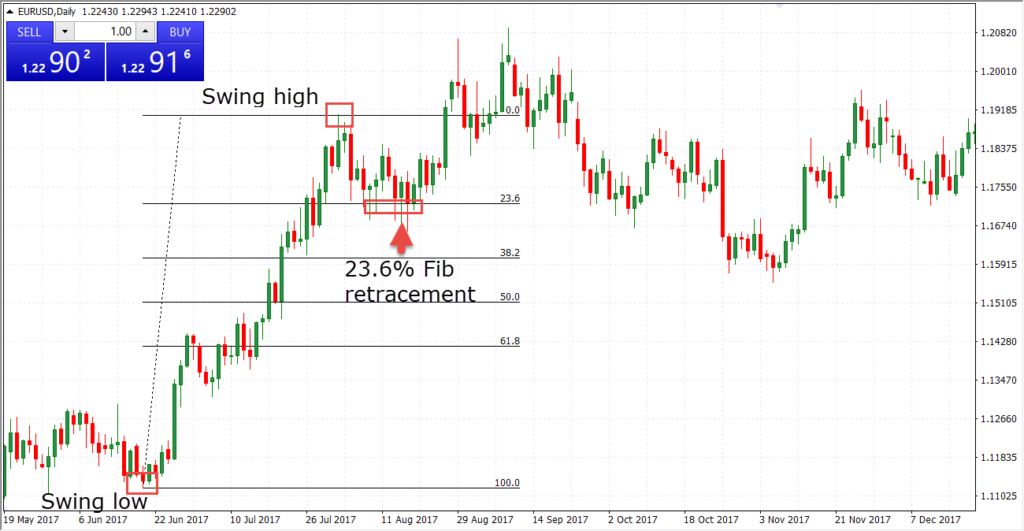
And finally, to conclude this brief introduction to chart analysis on the MetaTrader 4 platform, let’s see how to use and draw Fibonacci retracements on the chart. The Fibonacci tool is used to find price-levels where a “higher low” may form during an uptrend, or a “lower high” during a downtrend.
To draw the Fibonacci retracements on your chart, click the Fibonacci tool on your Toolbar and select the swing lows and highs on your chart, which represent the initial move of the trend.
![]()
The Fibonacci tool will draw percentage levels between the selected swing low and high, with the 23.6, 38.2 and 61.8 levels usually being the most important levels where the price might retrace.
Now that you’ve broadened your understanding of the MetaTrader 4 platform and learned how to perform basic chart analysis using the built-in charting tools in your trading platform, let’s move on to a few important tips on drawing support and resistance levels.
Tips on Drawing Support and Resistance Levels
-
How Far Back to Draw Support and Resistance Lines?
There is no hard rule on how far back support and resistance levels should be drawn. Younger support and resistance levels are usually more important than older ones, as they represent a fresh price-level where the market had difficulties to break above or below.
As a rule of thumb, if you’re using higher time-frames such as the weekly one, focus on the past 12 months of price-data to identify potential swing-highs and swing-lows which could act as support and resistance for the price.
-
How to Draw Support and Resistance Lines in 15-Minutes Chart in Forex?
When drawing support and resistance lines, the same principles apply to all available timeframes. However, bear in mind that S&R levels on higher timeframes tend to be more important than S&R levels on lower timeframes, such as the 15-minutes one.
-
How to Draw Support and Resistance Lines on a Candlestick Chart?
Candlestick charts do a great job not only in creating graphically appealing price-charts, but also in identifying support and resistance levels. A candlestick consists of the candlestick’s body, which represents the opening and closing prices, and the upper and lower wicks, which represent the high and low prices reached during a trading session. You can use both the body and the wicks to draw support and resistance lines on candlestick charts.
The closing prices of a candlestick’s body tend to have a higher importance than the high and low prices represented by the wicks, since they show the prices at which market participants “closed their trading positions, took profits and went home by the end of the trading day.”
Pro Tip 1: Support and Resistance Levels Change Their Roles
An important characteristic of support and resistance levels is that they can change their roles once broken.
A broken support level becomes resistance in the future, while a broken resistance level becomes support in the future. This is very important to understand early in your trading career, as a popular trading strategy called pullback trading is built around this characteristic of S&R levels.
Pro Tip 2: Know the Difference Between Support and Resistance Levels and Zones
There is an important difference between support and resistance levels and zones.
As the names imply, a level is a specific price-level where the price might find support or resistance. A zone, on the other hand, refers to a zone of prices in which the price can retrace anywhere in between. Most of the time, the price doesn’t hit a S&R level right at the pip before it retraces. The closer the price reaches towards a S&R level, the higher the chance of a reversal.
- Learn more, take our free course: Reversal Price Patterns
Pro Tip 3: Use Multi-Timeframe Analysis to Identify Weekly, Daily and Shorter-Term S&R Levels
In practical trading, it’s a wise decision to perform multi-timeframe analysis (MTFA) on weekly, daily and shorter-term timeframes to identify long-term and short-term support and resistance levels. In essence, support and resistance levels on the higher timeframes tend to be more important than S&R levels on shorter timeframes.
Furthermore, different timeframes can show different trends on the same currency pair. A healthy uptrend on the 4-hour chart may look like a downtrend on the 15-minutes chart, while the downtrend may only be a counter-trend price-correction of the uptrend.
Final Words
The concept of support and resistance levels acts as a foundation for many advanced trading strategies, which is why you need to understand these concepts as early in your trading career as possible.
A support level refers to a price-level at which the price had difficulties to break below, while a resistance level refers to a price-level at which the price had difficulties to break above. As a result, traders anticipate that those levels could again form an obstacle for the price in the future. Support and resistance charts work great in all financial markets.
You May Also Like: