Trading Double Bottoms and Double Tops in Forex

Looking for a complete guide on how to trade double tops and bottoms in the Forex market? Then look no further.
Whether you’re a complete beginner or an experienced trader, I’m sure you’ll find a few handy trading tips in the following article.
We’ve covered everything you need to know to successfully trade double tops and bottoms, and will show you a few simple methods that can be used to increase the winning rate of those patterns.
So, let’s get started!
- Learn more, take our premium course: Trading for Beginners
Chart Patterns: An Insight into Market Psychology
Let’s start with a brief introduction to chart patterns. Even though chart patterns are considered by some as a hocus-pocus, they continue to deliver steady results if traded and analysed the correct way.
The Random Walk hypothesis, for example, suggests that the market moves in an unpredictable way and that all price-moves in the intraday chart should be treated as market noise.
However, professional day traders and technicians still manage to make consistent returns by using simple tools such as support and resistance lines, trend analysis and chart patterns. They do so by analysing the reactions and intentions of the real force behind any price-move: the power of buyers and sellers.
Chart patterns provide us with exactly that – a valuable insight into market psychology and the cumulative behaviour of market participants. Financial markets, such as the Forex market, are still mostly dominated by human traders who exhibit certain (predictable) behaviour, especially when they act as a crowd. It may be quite difficult to predict the future actions of an individual trader, but crowd behaviour is much more simple and primitive than the behaviour of an individual.
So, what are the main characteristics of crowds?
The French psychologist Gustave Le Bon made a significant contribution to the understanding of crowd dynamics in his book Psychology of Crowds from the late 19th century. This book is considered one of the seminal works on crowd behaviour and should be on the read-list of any serious Forex trader.
In the book, Gustave Le Bon describes how human behaviour changes when part of the crowd and shows that crowd behaviour can be easily anticipated by understanding a few simple rules. In the context of trading, crowds tend to follow other group members and nourish two simple emotions: fear and satisfaction.
The next time you see a strong breakout candle, think about a large number of buyers or sellers trying to join the ride which in turn pushes the price higher or lower. Also, have you ever noticed that uptrends and market tops take much longer to develop than market bottoms? Again, think about the basic emotions of crowds: fear is much stronger than satisfaction and causes a stronger market response, which in turn causes the price falling much faster than rising.
Alright, back to chart patterns now. Chart patterns allow us to analyse the psychology and behaviour of market participants (or the crowd.) Chart patterns are specific patterns in the price that signal either a continuation of the underlying trend (the satisfaction of rising prices) or its reversal (the fear associated with losses.)
Chart patterns also rely on one of the basic premises of technical analysis, which says that history tends to repeat itself. Since certain patterns in the price proved to have a certain prediction power in the past, technical traders assume that they can be used to anticipate future price-movements as well.
Finally, chart patterns usually take some time to develop – usually over a period of a few days to a few weeks. Bear in mind that chart patterns represent the behaviour of the crowd, and the more market participants are watching certain technical levels, the higher the probability that the chart pattern will correctly anticipate the future price direction.
Types of Chart Patterns
As we already mentioned, there are two main types of chart patterns:
- Continuation patterns – This type of patterns signal that the underlying trend is about to continue. They usually form during consolidation phases in the price after a strong up- or down-move. Market participants take a break during consolidation phases, assess the fair value of an exchange rate (is the current price overbought or oversold), and new market participants are starting to join the crowd in anticipation of a continuation of the underlying trend.Popular continuation chart patterns include rectangles, triangles, bullish wedges during uptrends, bearish wedges during downtrends, pennants.
- Reversal patterns – As their name suggests, reversal chart patterns signal that the underlying trend has reached its top/bottom and that traders should prepare for a potential trend reversal. Most reversal patterns try to identify whether the price has formed a fresh ceiling (higher high) or a fresh floor (lower low). An absence of higher price during uptrends and lower prices during downtrends suggest that market participants who pushed the price higher/lower are losing steam.
Popular reversal patterns include the head and shoulders pattern, inverse head and shoulders pattern, double tops and bottoms, triple tops and bottoms, bearish wedges during uptrends, bullish wedges during downtrends, symmetrical triangles (which can be both continuation and reversal patterns, depending on the direction of the breakout.)
- Learn more, take our free course: Continuation Price Patterns
- Learn more, take our free course: Reversal Price Patterns
What is a Double Top and Double Bottom Pattern?
So far, we’ve learned what chart patterns are and how they’re grouped into continuation and reversal patterns. Now, let’s dive deeper into one of the most popular reversal chart patterns: The Double Top and the Double Bottom pattern.
Double tops and bottoms are reversal patterns that signal an upcoming reversal of the underlying trend. A double top pattern usually forms at the top of an uptrend with the price failing to form a fresh higher high. Instead, the price finds resistance at a previous swing high and reverses, forming two highs at roughly the same price level (hence the name, double top.)
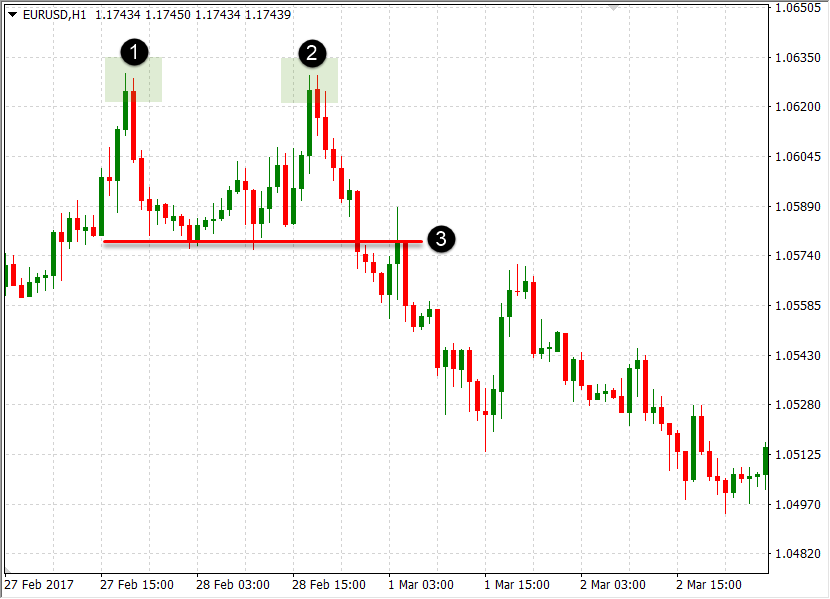
A double top pattern is shown in the following EUR/USD chart. Notice points (1) and (2), which are the actual double top. At point (2), the price failed to break above and to form a fresh higher high. The high at point (1) acted as a horizontal resistance level, and once the price rejected that level, market participants who were long started to close their positions, which in turn pushed the price even lower. Fear emerged inside the crowd, causing a strong fall in the price.
Line (3) is the neckline of the double top pattern. It aligns with the lowest point between the two tops, which is the higher low of the uptrend. A fall below the neckline signals that a fresh lower low is under way and can be used to enter into a short position.
A double bottom pattern is quite similar to a double top, only that it usually forms during downtrends and signals an upcoming uptrend. In a double top pattern, the price fails to form a fresh lower low and faces support at the previous swing low, which now acts as a horizontal support level for the price. A double bottom pattern is recognised by two bottoms in the chart at roughly the same horizontal level.
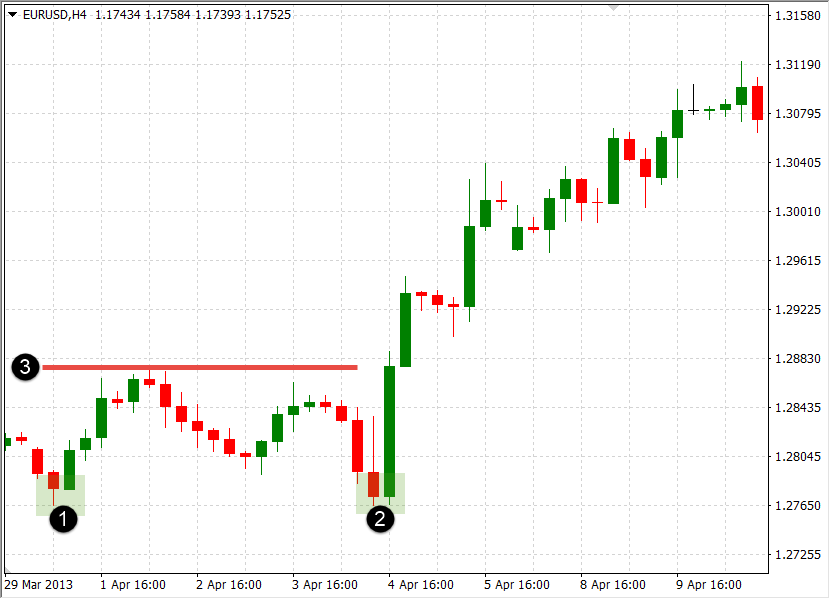
The following chart shows a double bottom pattern in the EUR/USD chart. Point (1) acted as the lower low of a downtrend, but the price failed to break below that level, faced increased buying pressure and reversed at point (2). The neckline of the pattern, marked (3), acted as the lower high of the previous downtrend, and a break above that level signals that a fresh higher high is coming and that it might be a good idea to think about buying the pair.
How to Find High-Probability Double Top and Bottom Patterns
Even though chart patterns have a proven track-record and reveal a lot about current market psychology, they return even better results when combined with some additional technical tools.
Here’s a list of effective tools that can be used to increase the success rate of chart patterns, such as double tops and bottoms, and to confirm their short/long trading signal:
- Trend-analysing tools: Double tops form at the top of an uptrend, while double bottoms signal the bottom of a downtrend. Other trend-analysing tools can be used to confirm a double top/bottom. For instance, if the price breaks below a rising channel during an uptrend while previously forming a double top pattern, a trader has a double-confirmation to enter short.
- Fibonacci levels: Fibonacci levels measure the extension of a price-correction (i.e. a counter-trend move) during uptrends and downtrends. If the price forms a double top or double bottom and then breaks below/above an important Fibonacci level, such as the 50% or 61.8% retracement level, the success rate of the double top/bottom pattern will significantly increase.
- Candlestick patterns: Last but not least, candlestick patterns are a great tool to use in any trading strategy and can be used to confirm the trading signal of a double top/bottom pattern. If the price breaks above/below the neckline with a strong marubozu candlestick, or the price forms a reversal candlestick pattern at the pullback to a previously broken neckline, the success rate of the pattern will be much higher.
- Learn more, take our free course: Fibonacci: Fast-Track
How to Trade Double Tops and Bottoms?
Regardless of what technical tools you’re using to confirm a chart pattern, there are certain rules which need to be followed when trading double tops, bottoms or any other pattern. You can use any of the approaches highlighted below that suit your trading strategy and style.
- Enter short/long on neckline breakout
As explained earlier, the basic approach to trading double tops and bottoms is to trade in the direction of the neckline breakout. For a double top, that would be going short after the price breaks the neckline to the downside, and for a double bottom pattern, going long after the price breaks the neckline to the downside.
With this approach, it’s important to wait for the breakout candlestick to close before entering into a trade. This will help you to avoid fake breakouts and increase the success rate of your trade. Also, if you combine this approach with an additional confirmation tool (e.g. candlestick patterns), you could look for strong marubozu candlesticks at the breakout point to confirm a short setup.
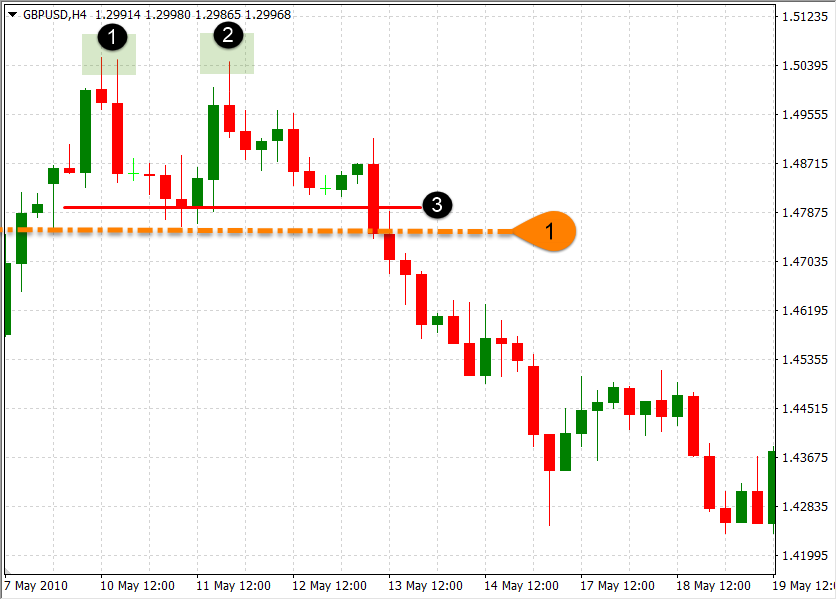
The chart above shows the breakout approach on the GBP/USD pair. After the price formed a double top pattern, a strong bearish candle broke and closed below the neckline (3). You could enter into a short position at line (1), and place a stop just above the breakout candle. The same rules apply when trading breakouts in double bottom patterns.
- Determining exit points
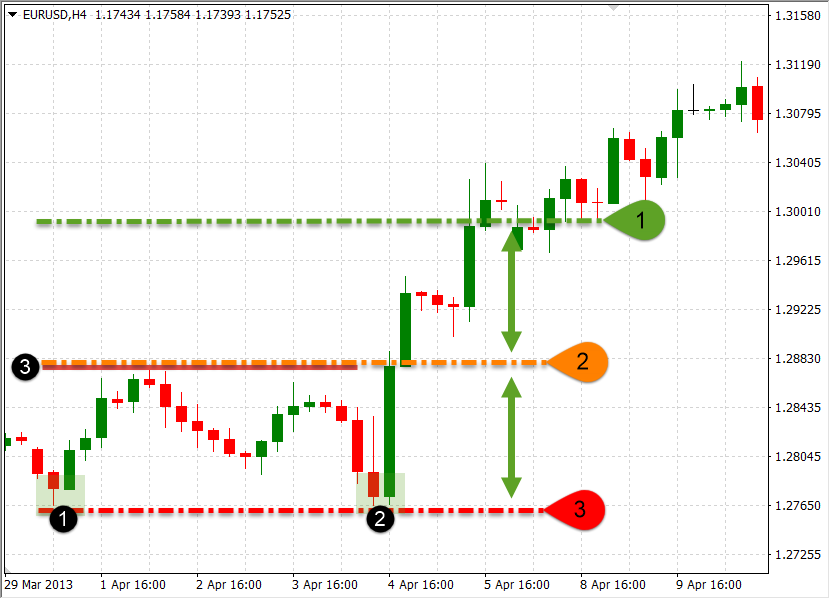
When trading double tops and bottoms, the usual profit target should equal to the height of the pattern, projected from the breakout point. The following chart shows a double bottom pattern on the EUR/USD chart. After the neckline of the pattern got broken, a trader could place a take profit order at line (1), which equals the height of the pattern.
The size of your stop-loss depends on your risk management rules and personal risk tolerance.
- Risk-averse traders could place their stops just below the breakout candle as the neckline will act as a support (in double bottoms) and resistance (double tops) once the pattern gets triggered.
- Risk-tolerant traders could aim for a wider stop and place a stop-loss just below a double bottom (line 3 in chart above), or just above a double top pattern. This approach allows the price to breath, but also returns higher losses if the stop-loss order gets triggered.
- Entering after the price completes a pullback
Since the neckline of a double top and double bottom pattern basically acts as a support and resistance, respectively, a trader could wait for a pullback to enter into the direction of the breakout. This approach usually returns the best results when trading double tops and bottoms, as the rejection of the neckline area proves that a large number of market participants is following those levels and that traders who’ve missed the first ride are now waiting for the opportunity to join the second ride.
That being said, the pullback approach is great if you’ve missed the initial breakout. The market will often complete a pullback to the broken support/resistance area, offering you a second opportunity to join the crowd.
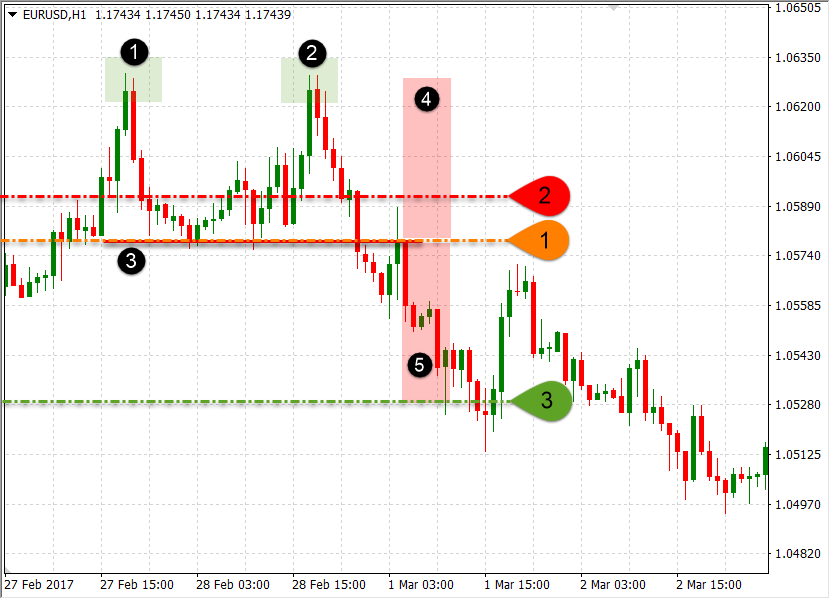
The following chart shows a double top pattern in the EUR/USD pair. The actual pullback is shown in the red shaded rectangle (5), with line (1) acting as the entry level. Line (2) shows the stop-loss position of a risk-averse trader, while rectangle (4) measures the height of the pattern which is then projected from the entry point to the downside, forming the exit point (profit target) at line (3).
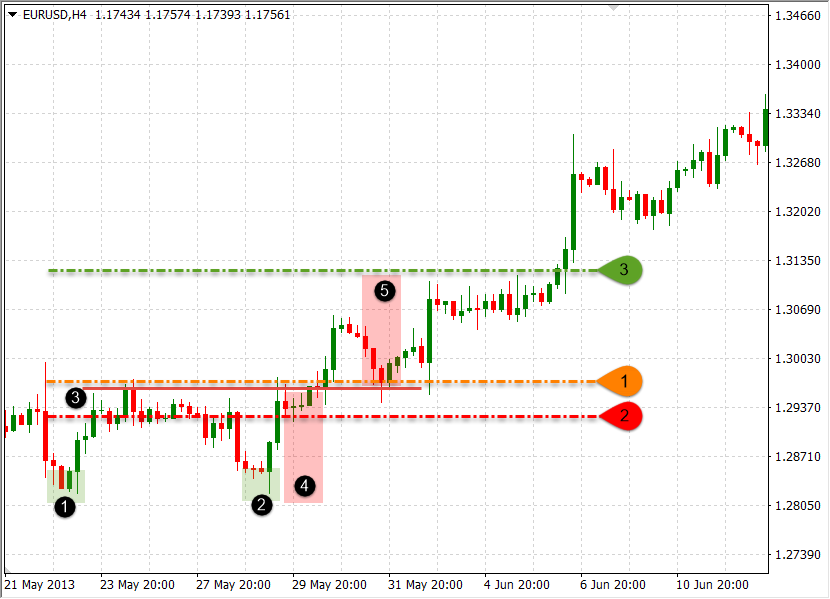
Pullbacks are traded in a similar way in double bottom patterns. Take a look at the next chart. The red rectangle (5) shows the actual pullback to the broken neckline, with line (1) acting as the entry level. Line (3) is the profit-target which equals to the height of the pattern, as shown by rectangle (4). Line (2) represents a stop-loss order, placed just below the pullback.
Double Top/Bottom Indicators
You can also combine various technical indicators to improve the success rate of a trade based on double tops or bottoms. While I’m not a fan of indicators (I prefer pure price-action combined with fundamentals), I’ll share with you two effective indicators for chart pattern trading:
Relative Strength Index: The RSI is commonly used to identify overbought and oversold market conditions. It’s a momentum indicator that measures the magnitude of recent price-movements and can be used to measure the strength of the double top/bottom breakout.
- Learn more, take our free course: Relative Strength Index: Fast Track
Average Directional Movement Index: The ADX is a popular indicator that measures both the strength and the direction of an established trend. Readings above 25 signal a trending market, above 50 a very strong trend and above 75 an extremely strong trend. Since double tops and bottoms are reversal patterns, the ADX reading should confirm that a trend had been established before the formation of a double top/bottom.
For traders who prefer to use EAs and technical indicators to identify double tops and bottoms, there’s good news:
There are dozens of indicators available on the internet that analyse the market and notify you once a valid double top or bottom has been identified. However, I strongly encourage you to keep developing your own trading skills and trade on your own.
These patterns are not complex and can be successfully traded with some screen-time and experience.
Bonus: Best Timeframes to Trade Double Tops and Bottoms
Although double tops and bottoms can be found and traded on all timeframes, certain timeframes work better and return a higher chance of success than others.
Again, crowd psychology plays an important role. People memorise and remember prices at which the market had difficulties to break above or below (resistance and support.) How many market participants do you think actually follow the 5-minute chart? And will they consider a horizontal support or resistance level (which forms the basis of a double top and bottom) to be of large importance on such a short timeframe?
On the other side, how many traders follow the daily chart and consider a support or resistance level formed 10 days ago as important? The answer is: a lot. We need a large number of people to be prepared to enter into the market once an opportunity arises in order to increase the success ratio of any chart pattern, and the daily chart offers exactly that.
Besides the daily chart, popular timeframes to trade double tops and bottoms include the 4-hour chart and weekly chart. Shorter-term traders could trade them on the 1-hour and 30-minutes charts but have stricter entry rules in place in order to avoid trading on fake breakouts.
Final Words
Double tops and bottoms are reversal candlestick patterns that usually signal a trend reversal after an uptrend or downtrend, respectively. Trading these chart patterns is not hard, but traders need to understand the market psychology and dynamics that lie behind them as described in this article.
To increase the success rate of double tops and bottoms, consider using additional tools as confirmations, such as Fibonacci levels and candlestick patterns. Also, assess your risk tolerance to find the best place to set your stop-loss orders.