Trendline Trading: What to Do (And Not to Do)

Markets like to trend as supply and demand are not always in balance.
Increased supply over a period of time pushes prices lower, as sellers are lowering their prices to find buyers in the market. Similarly, increased demand pushes prices higher over time, as buyers keep bidding prices to higher levels.
In essence, those forces create uptrends and downtrends. Uptrends are characterised by consecutive higher highs and higher lows in the price, while downtrends are represented by consecutive lower lows and lower highs in the price. If there’s an absence of trends, we call that market a ranging market.
Trend-following trading strategies have a huge following among Forex traders and one of the most efficient tools to follow a trend are trendlines. Trendlines are lines that connect consecutive higher lows in an uptrend and lower highs in a downtrend. Trendlines that are applied to an uptrend are often called “rising trendline”, while trendlines that represent downtrends are also called “falling trendlines.”
While they’re relatively easy to apply and draw on a chart, here are some important trendline trading tips that all trend-followers need to know about.
- Learn more, take our premium course: Trading for Beginners
Trendline Trading Tips
Look for at least three touches on the trendline
When trading with trendlines, make sure that the price touches the trendline at least three times. Although a trendline can also be drawn with only two touches of the price, these trendlines shouldn’t be considered as relevant for trading.
One of the most common mistakes regarding trading with trendlines is to trade on an unconfirmed trendline which connects only two points of the price. As a rule of thumb, the more times the price has touched the trendline in the past, the more important the trendline becomes.
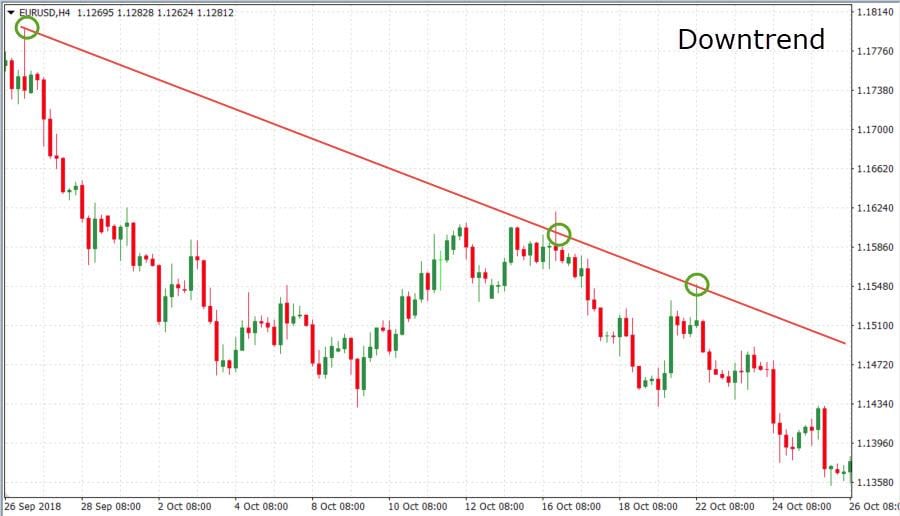
The following chart shows a confirmed trendline on the EUR/USD pair which has been tested three times so far. As you can see, the falling trendline connects consecutive lower highs in a downtrend.
A trader could enter with a short position each time the price reaches the trendline from below, touches it and reverses. A stop-loss order should be placed just above the trendline.
Another common mistake is to move a trendline to get a tradeable and actionable setup. In this regard, trendlines are very subjective. Every trader can fine-tune a trendline to get a long or short opportunity. That’s why it’s so important to combine trendlines with other tools, which is covered in point no. 4.
Measure the time between consecutive touches
Besides trading bounces off a trendline, you can also look to trade breakouts above a falling trendline and below a rising trendline. These breakout trades are usually followed by a large trading momentum in the direction of the breakout, which makes them a popular trading approach among day traders.
However, before a breakout occurs, the price tends to cluster around the trendline and the time between the consecutive touches tends to become shorter.
This is best explained by the next chart.
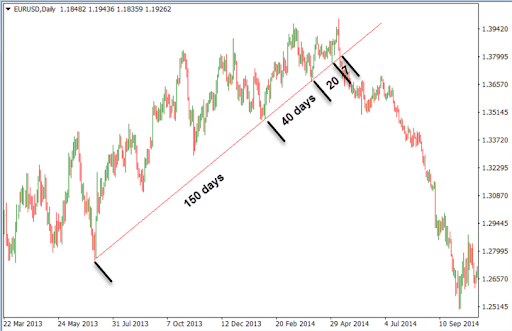
As you can see on the EUR/USD chart above, we draw a trendline that connected four higher lows between 2013 and 2014. As the uptrend started to lose momentum, the times between each consecutive touch on the trendline became shorter.
Finally, the time between the last two touches was only seven days, after which the pair broke below the trendline and started a strong downtrend. Buyers weren’t strong enough to defend the trendline as sellers kept pushing the price lower.
Read:
- Why is Stop Loss Trading so Important?
- Tips and tricks for a 1 Minute Scalping Strategy in Forex
- Awesome Futures Trading Strategies (And Ones to Avoid)
Fake breakouts
Fake breakouts are very common when trading with trendlines. Unexperienced traders who’re looking to trade trendline breakouts find it often difficult to differentiate between real and fake breakouts.
A fake breakout occurs when the price looks like breaking above or below a trendline, only to reverse its course and leave the breakout trader with a losing position.
Here’s an example of fake breakouts.
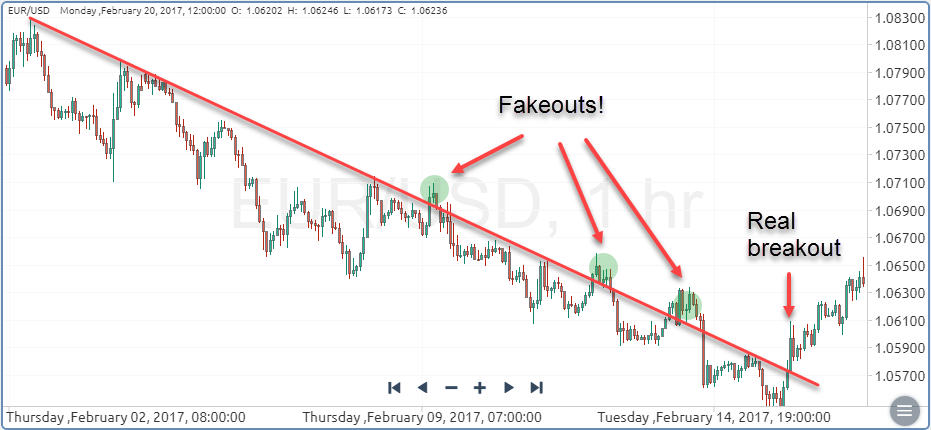
Almost all trendlines that you apply to a chart will occasionally have fake breakouts. The key is to connect as many higher lows (or lower highs) as possible, and leaving the fake breakouts outside the trendline.
Fake breakouts are actually a great trading setup, especially if they come together with bearish or bullish indicator divergences. This is one of my favourite trading strategies – catching fake breakouts with pinbar patterns and confirming them with RSI or Stochastic divergences.
When trading fake breakouts, you have to wait for the price to actually reverse inside the trendline. Those candlesticks that form fake breakouts often have long upper or lower wicks, signaling that sellers (buyers) are joining the market and pushing the price back inside the trendline. This is a powerful price-action signal to enter in the direction of the trend.
- Learn more, take our free course: Reversal Price Patterns
Use other tools to confirm a setup
While trendlines and fake breakouts can produce many successful trading signals, it’s still important to confirm a trade setup before entering into a trade. Popular tools to confirm trades based on trendlines include Fibonacci retracements, candlestick patterns, and technical indicators.
Since trendlines are used to connect to higher lows during uptrends and lower highs during downtrends, we’re of necessity dealing with a trending market. That’s where Fibonacci retracements come into play.
In an uptrend, we want to catch the end of a price correction (counter-trend move) that bounces off a rising trendline. If that level also aligns with an important Fib level, such as the 38.2%, 50% or 61.8% level, we have a high-probability setup that we can trade.
Take a look at the following chart.
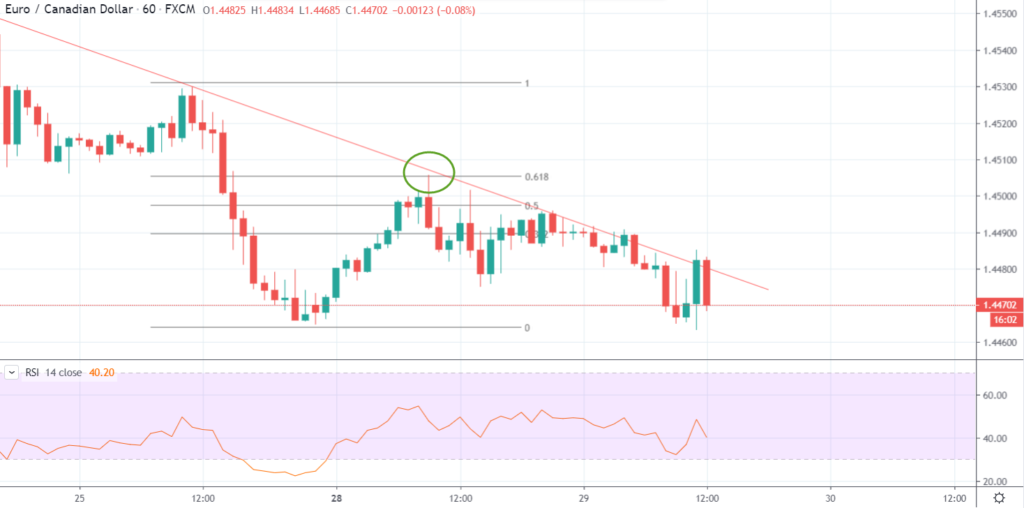
The EUR/CAD pair reached a falling trendline at a level that aligns with the 61.8% Fib level. This gave us a double-confirmation to enter with a short position by placing a stop-loss just above the trendline.
Candlestick patterns are also a popular tool to confirm a setup based on a trendline. Strong bullish or bearish candlestick patterns, such as engulfing patterns, Marubozu patterns, or reversal evening and morning star patterns that form right at a trendline can be used as a confirmation to enter into a trade.
Finally, overbought and oversold levels of oscillators, as well as bearish and bullish divergences that form around trendlines often confirm high-probability trade setups.
All mentioned confirmation tools can also be used when trading fake breakouts.
Read:
- What is Online Trading and How Does it Work?
- How to Enter Price-Action Trades
- 22 Day Trading Strategies the Pros Don’t Want You to Know
Trendlines work better on higher timeframes
Just like most other technical tools, trendlines return better results when applied to and traded on higher timeframes, such as the 4-hour, daily, and weekly ones. A large number of market participants follow trendlines and other technical levels on longer-term charts, which increases their importance as well.
Shorter-term charts include mostly market noise that is very difficult to trade and track. Even if you’re a shorter-term trader, such as a day trader, your trading performance can increase significantly if you apply trendlines to longer-term charts and zoom into shorter-term charts to find entry and exit points.
Wait for pullbacks to confirm a broken trendline
As most traders already know, once a horizontal support or resistance level breaks, that level changes its nature – a broken support level becomes a resistance level, and a broken resistance level becomes a support level.
Trendlines work quite similar to horizontal support and resistance level. A trendline acts as a support for the price when applied to consecutive higher lows in an uptrend, and as a resistance when applied to consecutive lower highs in a downtrend. Once a rising trendline is broken, that trendline becomes a resistance for the price. Similarly, once a falling trendline is broken, that trendline becomes a support for the price.
- Learn more, take our free course: Trends, Support & Resistance
If you don’t catch the initial breakout above or below a trendline, don’t chase the market. Instead, wait for the price to complete a pullback to the broken trendline to enter in the direction of the breakout.
The following chart shows a breakout followed by a pullback.
A trader who missed the initial breakout could wait for the pullback to enter with a short position. A stop-loss order could be placed just above the trendline or the recent swing high.
- Take our free course: Technical Analysis Explained
- Take our free course: Trends, Support & Resistance
- Take our free course: Japanese Candlesticks Decoded
- Take our free course: Reversal Price Patterns
- Take our free course: Continuation Price Patterns
- Take our premium course: Trading for Beginners
What to Avoid When Trading Trendlines
So far, we’ve covered some tips and tricks on how to trade trendlines. Still, when it comes to trendline trading, there are some common mistakes made not only by beginners but also by experienced traders. We’ve covered the top three things to avoid when trading on trendlines in the following lines.
Don’t trade on unconfirmed trendlines
This point refers to the first and fourth points mentioned earlier. For a trendline to be valid, the price has to touch it at least three times. It’s not enough to draw a trendline based on only two touches of the price.
As a rule of thumb, the more times the price touches a trendline, the more important the trendline becomes.
Besides having a confirmed trendline to trade on, you should also wait for a trade setup to confirm after the price reaches near the trendline. This can be done with tools such as candlestick patterns, Fibonacci retracements and bullish/bearish divergences of technical indicators.
Don’t move your trendline after you enter a trade
Another common mistake when trading trendlines is to move a trendline to get a nicely-looking trade setup. It’s easy to find buy or sell opportunities by moving trendlines and adjusting their slope, but we strongly advise against this practice.
Once you apply a trendline based on at least three touches of the price, leave it as it is until it gets broken. Any failure by the price to break a trendline should be considered a fake breakout (which, by the way, can be a great trading opportunity.)
Trendlines that are too steep are not sustainable
Finally, trendlines that are too steep get usually broken faster than trendlines that have a smaller angle. According to the Gann theory, uptrends and downtrends can often be described by trendlines at a 45-degree angle.
A strong uptrend rising at a 70-degree angle soon becomes heavily overbought, which means that traders would be better off trading a breakout to the downside than joining the trend at a possible peak.


