What is Volatility? And Strategies to Trade It
Trading is exciting, especially if we anticipate the direction of the market correctly and make a profit.
But, what if we could increase our bottom line without actually predicting the direction of the market?
Welcome to volatility trading.
In this article, we’ll explain what volatility is, how it’s measured, and how traders can take advantage of price-moves in any direction.
- Learn more, take our Trading for Beginners Course
What is Volatility?
Volatility is a measure of price-change during a specified amount of time. When markets are volatile, this means that prices are changing fast in a short period of time. On the other hand, non-volatile markets refer to markets where prices change very slowly or remain totally unchanged.
Any instrument that experiences a change in price exhibits volatility. Volatility trading refers to trading the volatility of a financial instrument rather than trading the price itself. Traders who trade on volatility don’t worry about the direction of price-moves. They’re simply trading the volatility, i.e. how much the price of an instrument will move in the future.
Options are a popular tool used to trade on volatility. In essence, the expected future volatility of an option’s underlying instrument plays an important part in the value of the option. Options on instruments that have a higher expected future volatility are generally more valuable than options on instruments that have a lower expected future volatility.
- Take our free course: Getting Started with Charts
- Take our free course: How Traders Interact with the Markets
- Take our premium course: Trading for Beginners
Why is Volatility Important?
Financial markets can be quite volatile, with large swings in the price on a monthly or even daily basis. Without volatility, there would be no profit potential in the markets. Investors and traders live on volatility.
Although volatility also increases the risks associated with trading, it can also lead to high returns if traded correctly.
How to Measure Volatility?
Volatility is traditionally measured using the standard deviation, which measures how far away the current price trades relative to its mean or moving average. Many factors can influence the volatility of financial markets. News reports, macro-economic data, earnings reports, and political and national economic factors all can have a significant impact on volatility.
Read:
For example, imagine the earnings report of a large multinational company misses market expectations and comes in lower than expected. This usually causes a large change in price and increased volatility for the company’s stock.
Monetary policy meetings of central banks can also have a large impact on volatility. If a central bank lowers interest rates, for example, markets could react violently, with the domestic currency usually depreciating and the stock market gaining on hopes of higher corporate profitability.
A popular tool to measure and detect market volatility and investor risk is the Volatility Index (VIX) of the Chicago Board Options Exchange (CBOE). The Volatility Index is also often called the “fear index”, as higher readings signal rising fear among market participants.
The VIX index calculates the implied volatility (IV) of a basket of options, both put and call, on the S&P 500 index over the next 12 months. A high reading of the VIX index signals higher volatility in the S&P 500, while a lower reading indicates less implied volatility over a 1-year period.
When the VIX index rises, the S&P 500 usually drops. Investors are often buying stocks on high VIX readings.
Read:
Strategies for Trading Volatility
Traders who trade volatility are not interested in the direction of the price movements. They make a profit on increased volatility, whether the price goes up or down.
In the following part, we’ll explain how to take advantage of volatility in the markets with the Straddle strategy, using pending orders or options.
Straddle Strategy with Pending Orders
The Straddle Strategy is one of the most popular strategies that aim to take advantage of increased volatility in any price direction. This strategy returns a profit when the price goes strongly in one direction, whether up or down. That’s why this strategy works best when used during periods when a high increase in volatility is expected, such as before important market reports.
When used with pending orders, a trader needs to identify a market in consolidation ahead of an important market release and place a buy stop pending order above the upper consolidation resistance, and a sell stop pending order below the lower consolidation support.
This can be seen in the following chart. The chart shows the EUR/USD pair that entered a consolidation phase with low volatility. A volatility trader could place buy stop orders a few pips above the upper resistance and a sell stop order a few pips below the lower support. A change in the price in either direction will trigger one of these pending orders, and if the volatility persists, the trade would return a profit.
Pending orders are orders that become market orders once certain pre-specified conditions are met. A buy stop order becomes a buy market order when the market reaches a pre-specified price from below, while a sell stop order becomes a sell market order when the market reaches a pre-specified price from above.
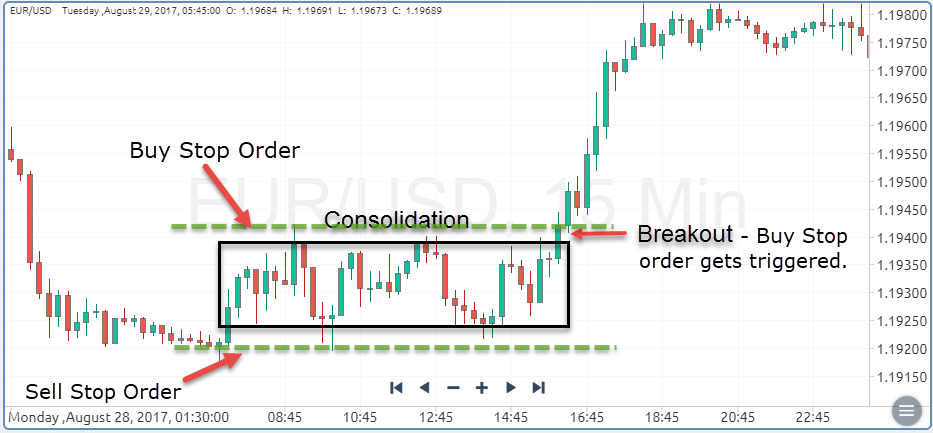
In the example above, the price broke out above the consolidation range and triggered the buy stop order which automatically opened a buy market order. Stop-loss levels should be placed just below the upper consolidation level, which should act as a support level once broken.
Similarly, if the sell stop order gets triggered, a stop-loss should be placed just above the lower consolidation level, which should act as a resistance level once broken. Profit targets can be the height of the consolidation range, projected from the breakout point in the direction of the breakout, or a recent swing high or swing low.
Since volatility is what triggers a pending order in the Straddle strategy, traders often use this strategy just before important market reports are scheduled. Market reports can create enormous volatility in the markets, especially if they differ from market expectations to a large extent.
Read:
Trade Volatility with Options
Besides breakout trading, traders can also use options to trade volatility. The Straddle strategy can be successfully used with options as well. When using options to trade volatility, a trader could buy a call option and a put option with the same strike price and expiration date.
If the underlying instrument experiences a large price-move, either the put or call option will become in-the-money and return a profit. A rise in the price would make the call option in-the-money, while a fall in the price would make the put option in-the-money.
The following graphic shows how the Straddle strategy works with options of the same strike price and expiration date. A trader would face a loss only if both the put and call options are out-of-the-money. The more the price moves away from the strike price in either direction, the more profit the trader makes.
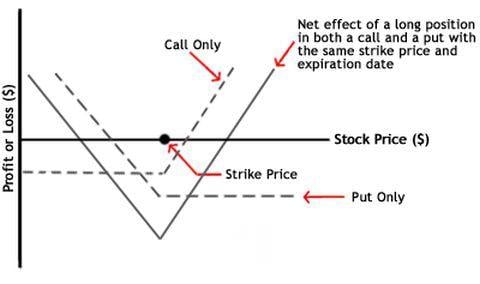
Image source: Investopedia.com
Read:
How to Trade If There’s No Volatility? The Short Straddle.
Option traders can also trade an expected absence of volatility by using the Short Straddle strategy.
Unlike the Straddle strategy, when traders buy both put and call options of the same strike price and expiration date, the Short Straddle strategy requires the trader to write or sell a call and put option at the same strike price and expiration date. This allows the trader to collect premiums on both the call and put positions if there’s no volatility in the market.
This is shown in the following chart.
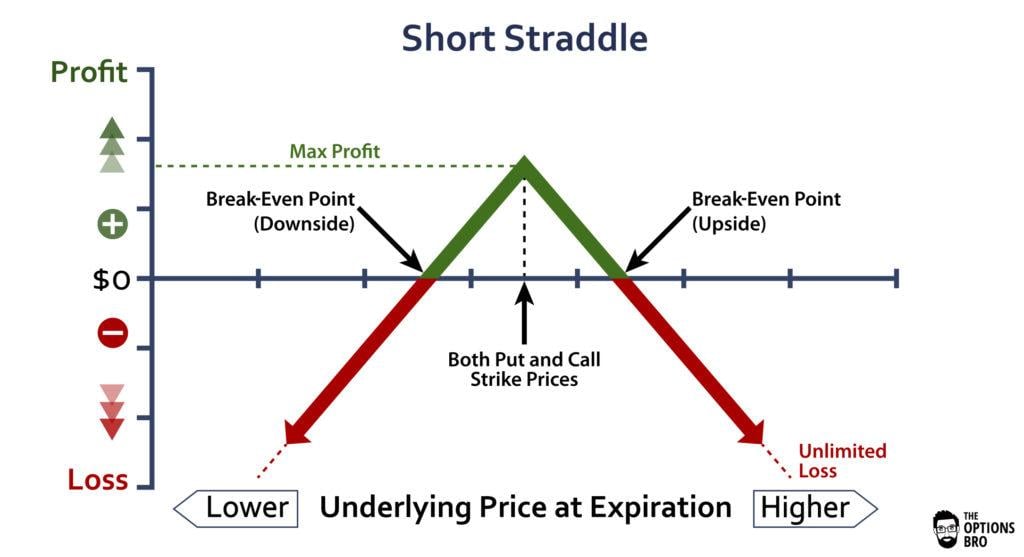
Image source: Optionsbro.com
Notice that there’s a possibility of unlimited loss when using the Short Straddle strategy. If stock XY rises to $150 or falls to $50, for example, the trader would be facing a heavy loss.
- Take our free course: Technical Analysis Explained
- Take our free course: Trends, Support & Resistance
- Take our free course: Japanese Candlesticks Decoded
- Take our free course: Reversal Price Patterns
- Take our free course: Continuation Price Patterns
- Take our premium course: Trading for Beginners
Final Words
Trading volatility is a great way to find profitable trading opportunities in the market without being right on the direction of the price. Volatility traders are only interested in volatility, i.e. large price-movements in any direction.
Volatility often occurs after important market reports, especially is the published number doesn’t match market expectations.
The VIX index is often used to measure volatility in the stock market. The index measures the implied volatility in both put and call options in the S&P 500 stock index – a rising VIX index often signals fear in the market which can be a good time to buy stocks. Popular trading strategies to trade volatility include the Straddle strategy, which can be utilised either with pending orders or options, and the Short Straddle strategy.
In essence, traders place pending orders above or below a consolidation zone to catch a potential breakout (rise in volatility) in either direction. When used with options, a trader would go long both a put and a call option with the same strike price and expiration date.
The Short Straddle strategy is used when a trader expects an absence of volatility, i.e. prices remaining the same. This strategy includes writing (selling) both put and call options and can theoretically lead to unlimited losses if stock prices surge. Traders who use this strategy can buy an additional put option above the current price to limit losses.