
Bar charts (OHLC)
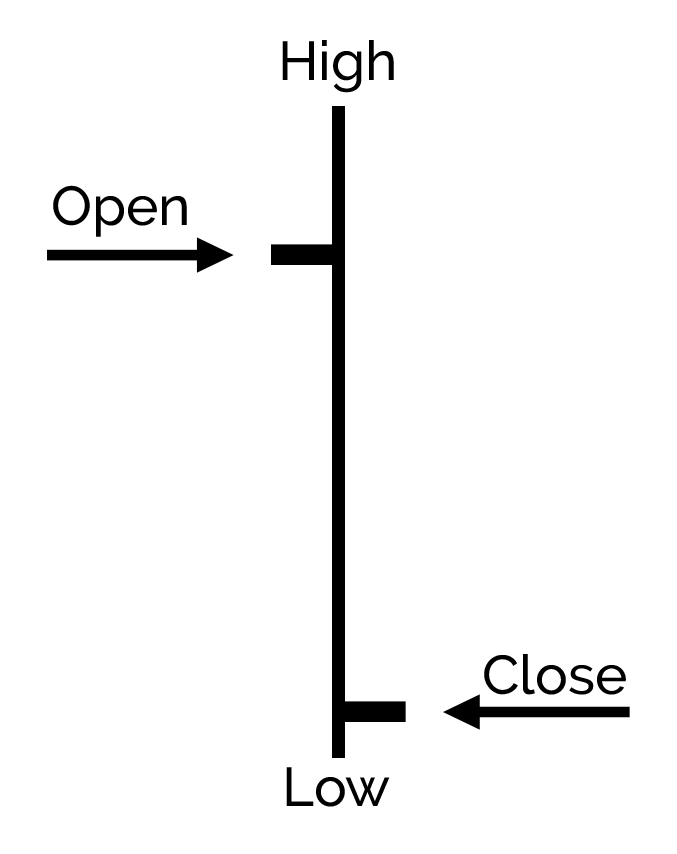
Bar charts display the opening, high, low and closing prices in a period.

This was for an ‘up’ period, a ‘down’ period would be:
Why traders use bar charts?
Traders use bar charts as they provide more information compared to linear charts. Sometimes these can be hard to read as they give all four prices the same visual weight when displaying, it can be hard for a trader to see how the market has performed at a glance.
Let’s see the same Apple data again, this time displayed as a bar chart:
Key Learning Points
- Bar charts as also known as Open, High, Low and Close (OHLC) charts because they show the four price points for each time period.
- Traders use bar charts because they display a lot more information about the market than a linear chart.
- However, bar charts give equal visual weighting to the four prices, which can be an issue for a trader wanting to interpret the chart quickly.