
Trendlines
Trendlines connect significant highs together or significant lows together. For a trendline to form we need to see at least three touches. The slope of this line determines whether its an up/bullish trendline or a down/bearish trendline. What we’re doing here is joining up the areas where the balance of power in the market shifted before as a dynamic line and not a horizontal. The lows are connected with a support line, the highs with a resistance line and together they form a channel. We’re then running these lines into the future to help identify potential areas of future support and resistance.
Bullish channels
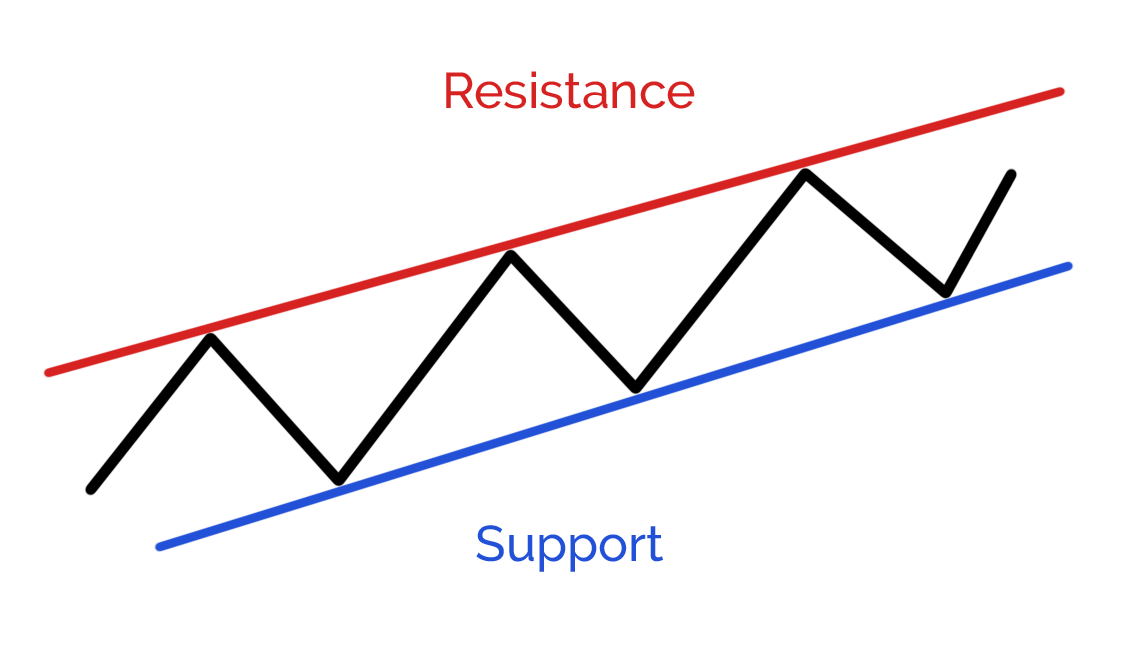
When looking at a bullish trend we can see the trendlines connect higher highs and higher lows. In a bullish trend, the support line is the important line, this is where the bulls that are driving the trend are really being challenged in their conviction.
Bearish channels
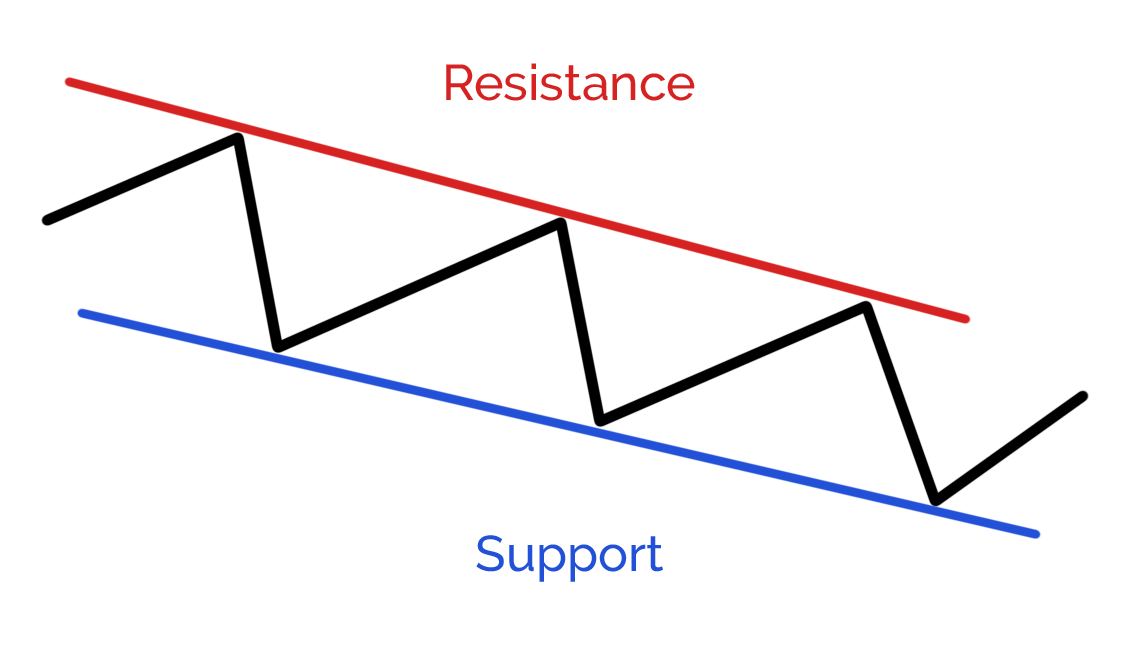
When looking at a bearish trend we can see the trendlines connect lower highs and lower lows. In a bearish trend, the resistance line is the important line, this is where the bears that are driving the trend are really being challenged in their conviction.
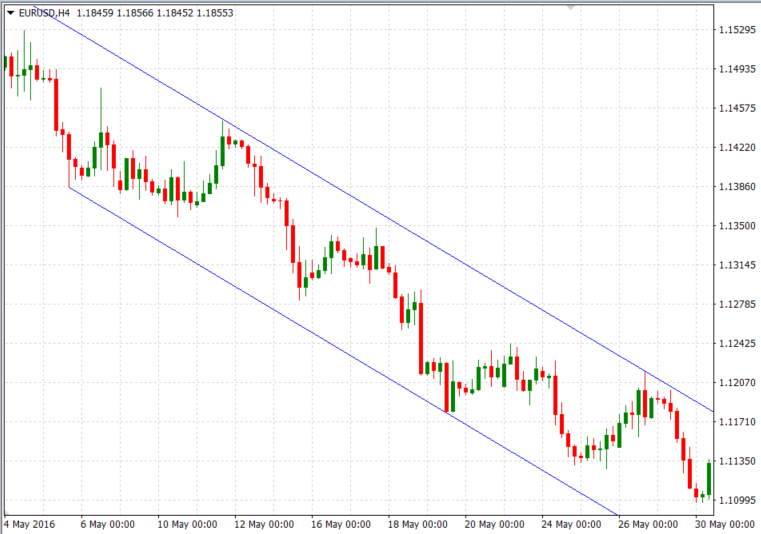
For a trendline to be valid the price needs to touch it at least three times. As with horizontals, the more times it is tested, whether it was tested recently and the volume traded when tested all add to the significance of the line. Here’s a good one in EURUSD:
Other indicators
Support and resistance can be self-fulfilling – for example, because lots of traders know how to draw trendlines or use horizontals they see the same potential support and resistance areas as others, set their trades up accordingly, and if enough participants in a market do something similar, it becomes self-fulfiling.
This self-fulfilment also extends to popular indicators. Widely used indicators – like the 20/50/200 day simple moving average, Fibonacci retracements, pivot points for example – can also suggest areas where potential support and resistance might occur.
Just remember, S&R develops at areas of psychological importance, so any tool, indicator or pattern that gets the participants trading as a collective has the potential to be used to help us predict it.
- Trendlines are dynamic potential support and resistance levels.
- We need to see at least three touches for it to be a valid trendline.
- Bullish channels connect higher highs and higher lows. In these, the support trendline is the important one.
- Bearish channels connect lower highs and lower lows. In these, the resistance trendline is the important one.
- Like with horizontals, the more touches, the more recent a touch and the volume traded at a touch all add to the significance of the trendline.
- S&R can also be identified using popular indicators, like moving averages, Fibonacci retracement and pivot points.