
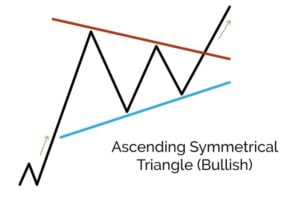
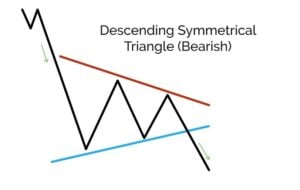
Symmetrical Triangles
Symmetrical triangle patterns are similar to ascending and descending triangle patterns, the difference being the highs are getting lower and the lows are getting higher, the support and resistance levels are coming together symmetrically. This type of continuation pattern appears in bullish and bearish trends.
Pattern confirmation again occurs when the price breaks through support or resistance. With symmetrical triangles, the most reliable breakouts occur from about halfway to three quarters along the full length of the triangle.
Be aware, symmetrical triangles can occasionally act as a reversal pattern but if you’re confirming the pattern correctly, as we’ve shown you, then you will not run into problems.
Breakouts
Let’s look at the breakout in a bit more detail. These are an important step for most price patterns to confirm, not just symmetrical triangles. Prices might track through the particular support or resistance line during a period but we obtain more confidence in the breakout, and therefore whether the pattern is confirmed when the following has been seen:
- The break is in on a closing price. Prices might track through support or resistance during a period but a closing price break is what we are looking for.
- The break is supported by a candlestick pattern – like a marubozu. We’ve gone through what these might look like in our Japanese Candlesticks Decoded course.
- The price returns and tests the S&R level it has just broken and the test holds.
Like with most things in technical analysis, its degrees of confidence we’re dealing with. We might not see all these but the more we do the more confidence we can have in the breakout.
Trading symmetrical triangles
Traders would trade it in a similar way to the other triangles. After breakout and pattern confirmation they would:
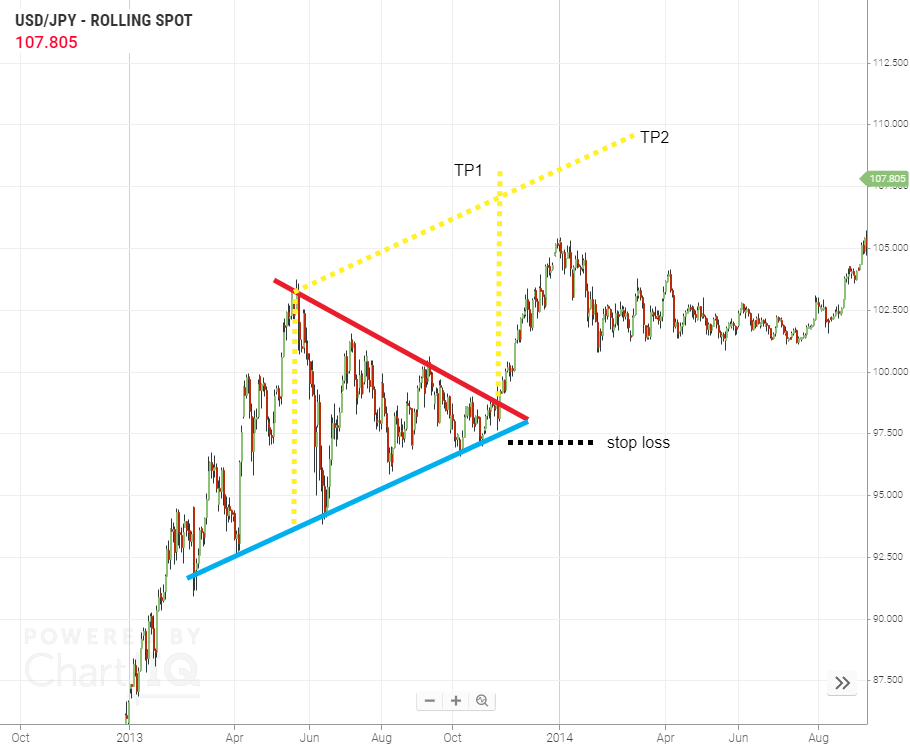
- Price target 1: the height of the triangle at its highest point, projected from the breakout; or
- Price target 2: mirror a parallel of the resistance line down from the first support touch.
- Set the stop above the pattern’s resistance or below the support line. If breached this would invalidate the continuation potential of the pattern.
Here’s a bullish symmetrical triangle in Dollar-Yen, there was a trend up into the pattern, it had a good duration, the price breakout was clean. The only note caution of is the breakout occurred after three-quarters of the way along the pattern’s width. This trade did eventually play out but the funding costs to get there would have been significant as it spent most of the year ranging sideways.
- Symmetrical triangles can be both bullish and bearish continuation patterns.
- Always remember confirmation is key, the pattern isn’t confirmed until the support or resistance level is broken and tested.
- We can gain confidence a breakout has occurred by ensuring it is on the closing price, supported by a candlestick pattern and if it has returned and tested the support or resistance level.