
Momentum vs volatility
Stochastics helps traders analyze momentum and not volatility. Volatility is the degree of variation in a price, it is not concerned with the direction of price, just how much it is moving by.
Momentum is the strength of price movement in a given direction.
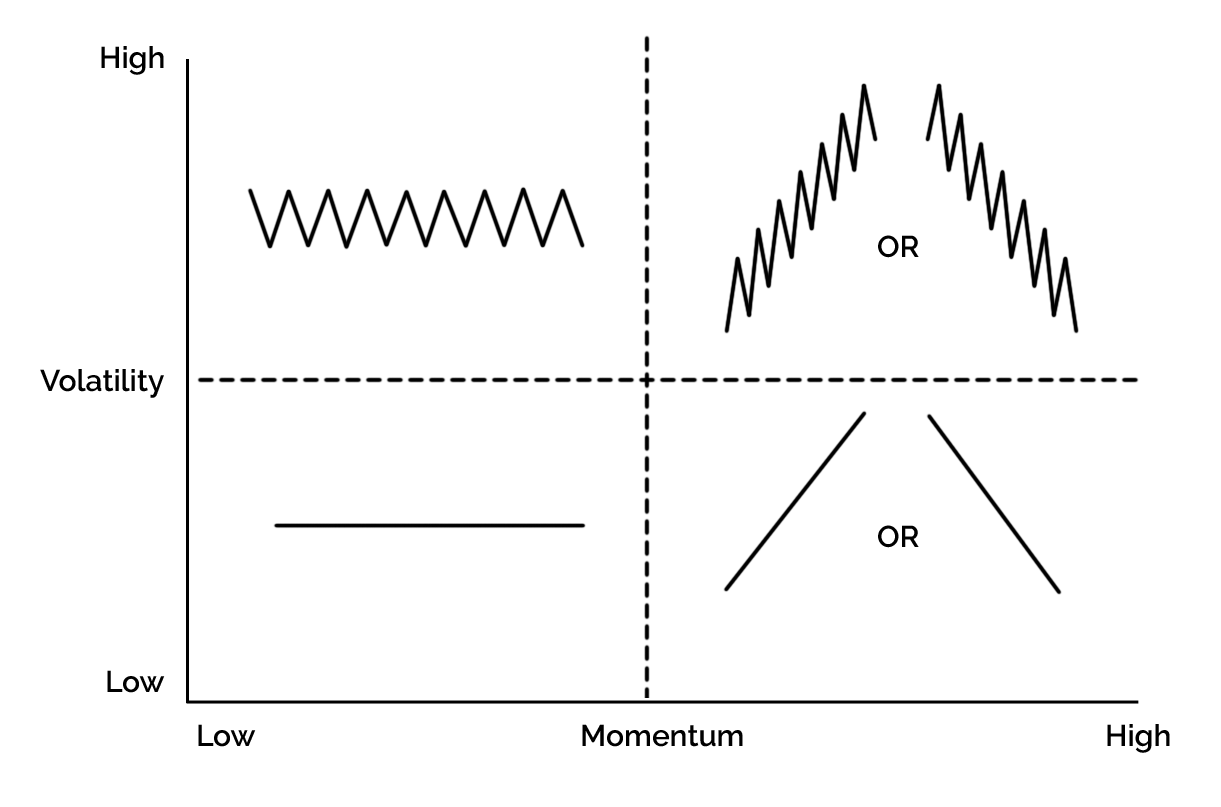
As trend-following traders the ideal set up is one with high momentum and low volatility, so the lower right quadrant. It doesn’t always work out like that, but that’s what we’re aiming to trade.
Overbought and oversold
The historic application of the indicator is identifying overbought and oversold setups. With Stochastics this is an objective assessment using the 80/20 boundaries. If overbought, traders might consider this an opportunity to go short and when oversold to buy.
When the %K, or if you want to be more certain %D, is over 80% then the market is considered overbought. If below 20% then it is considered oversold.
The issue with this simplistic approach is when long trends develop the indicator can stay overbought or oversold for long periods of time, as the trend matures.
%K and %D line crossovers
To try to accommodate this, some traders look for crossovers of the %K and %D lines when in the overbought or oversold areas. Because %D is an SMA of %K it lags it. When in the overbought area traders are looking for %K to cross down below %D, this is considered an indication the momentum has weakened. In an oversold area, traders are looking for %K to cross up above %D.

However, traders run into the same issues as with boundary crosses, albeit just later in the trend. When a trend develops they can get multiple false signals.
Divergence
Given the limitations of the more objective approaches, we think analysing for divergence is probably the best way to use Stochastics. Here, when Stochastics is in either the overbought or oversold areas, we are trying to find divergence between %K and price to suggest momentum in a trend is weakening.
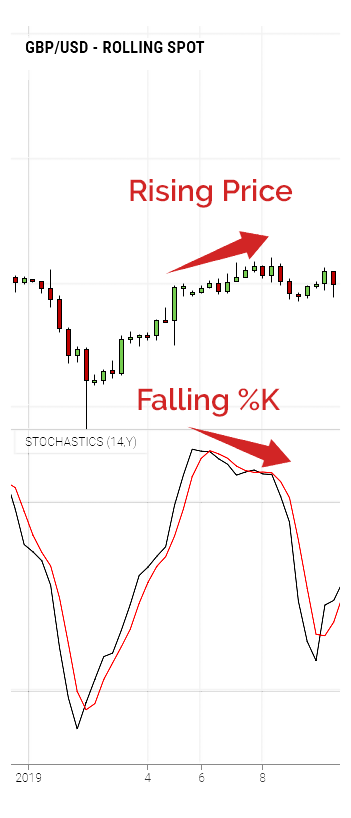
These are a lot rarer but it provides us with real insights into the power of bulls and bears if identified.
Limitations
Like many indicators is has its limitations, these are:
- It relies on only three numbers – lowest low, highest high and current close.
- Stochastics only looks at the extremes.
- It cannot recognize a trend.
Stochastics should be used for what it was designed for – to measure momentum. It should be used with other technical analysis tools and techniques to build up layers of evidence towards a trade.
- As trend following traders, the ideal setup is a trend with strong momentum and low volatility.
- Stochastics helps traders analyse momentum.
- Overbought and oversold areas are useful but don’t help much in established trends.
- %K and %D line crossovers are an improvement but have the same issues.
- The divergence between %K and price suggests a trend is losing momentum.