Brief Summary: A bullish market means that the price is going up and higher. There is positive momentum. The term “Bullish” is used because of the way a Bull attacks, moving his horns and head upwards and higher. If a trader believes the price will rise they are bullish.
A bearish market means that the price is going down and falling. There is negative momentum. The term “Bearish” is used because of the way a Bear attacks by swiping its paw in a downward motion. If a trader believes the price will fall they are bearish.
- Learn more, take our premium course: Trading for Beginners
Full Overview: To successfully ride a trend, you need to understand the main differences between bull and bear markets and how they form.
Prices don’t show the same behavioural patterns during bullish and bearish markets, and a variety of factors can lead to the formation of a new trend or the reversal of an existing one.
Here, we’ll explain what bullish and bearish markets are and how to trade them.
Types of Market Conditions
Markets can be either trading in a direction (trending) or moving sideways. Trending markets can be further divided into uptrends and downtrends, with the former ones often called bull markets and the latter bear markets.
Although some of you might think that the only way to trade the markets is to wait for clear signs of a bearish or bullish market, the truth is that sideways-moving markets can also be successfully traded. In trending markets, trend-following strategies produce spectacular results but fail to perform when markets are ranging.
Similarly, if you identify a ranging market, only use a trading strategy suitable for that type of market condition. We’ll explain how to trade markets that are trending further below.
Read: Why We Should Buy Low and Sell High
Bullish and Bearish Markets Explained
A bull market is a market that remains in an uptrend for a prolonged time when prices keep pushing higher. It’s important to note that single bullish sessions or short-term uptrends don’t represent a true bull market. Instead, prices have to be steadily going up for months or years for a market to be called bullish.
The term bull market is most often used when referring to the stock market going up. However, other financial markets can also be bullish, including commodities, currencies, and bonds. Even the real estate market can be called bullish if the prices keep trading higher over time.
The term bull market comes from the way of how bulls attack their prey. They will usually use their horns to lift their prey off the ground, hence the similarity with rising prices in a market.
A bear market, on the other hand, refers to a market where prices are continually falling. Markets can stay bearish for months or years, and just like the case with bull markets, a few days of falling prices isn’t usually enough for a market to be called bearish.
If you look at how bears attack their prey, it’s easy to make a connection with falling prices in the market. Bears attack by using their paws to push their victim to the ground.
How to Determine a Bullish and Bearish Market?
Bullish and bearish markets can be easily identified with a price-chart. Bull markets form consecutive higher highs and higher lows in the markets, with each higher high exceeding the top of the previous higher high and each higher low forming a higher bottom than the previous higher low.
This is best explained with a graphic. The following graphic shows a typical bull market.
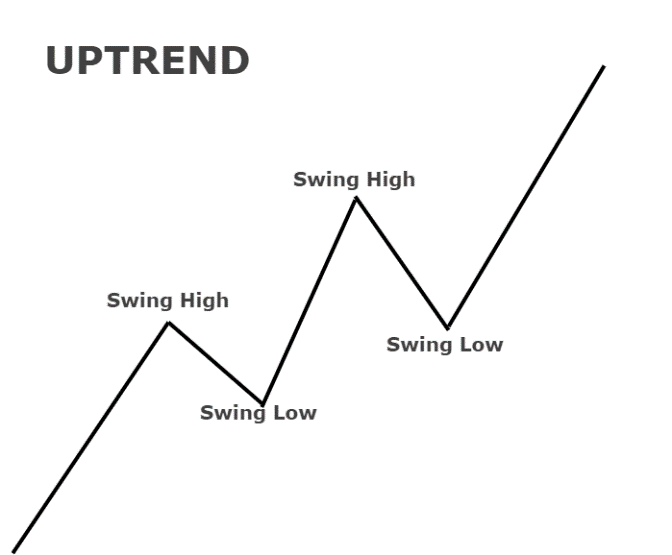
As can be seen, each consecutive higher high (swing high) and higher low (swing low) is higher than the previous one. Notice how the price occasionally falls on its way up – This is called a price correction and doesn’t represent a bear market. As long as the market forms fresh higher highs, it’s called a bull market.
Price corrections are normal formations that happen in both bull and bear markets. They represent counter-trend movements, caused by profit-taking activities, overreaction to news, or simply some large non-price-sensitive orders that push the price against the underlying trend.
Bull markets are similar to bear markets only turned upside down. In bull markets, the price forms consecutive lower lows and lower highs, with each lower low exceeding the bottom of the previous lower low and each lower high forming a lower top than the previous lower high.
Again, this is best explained with a graphic.
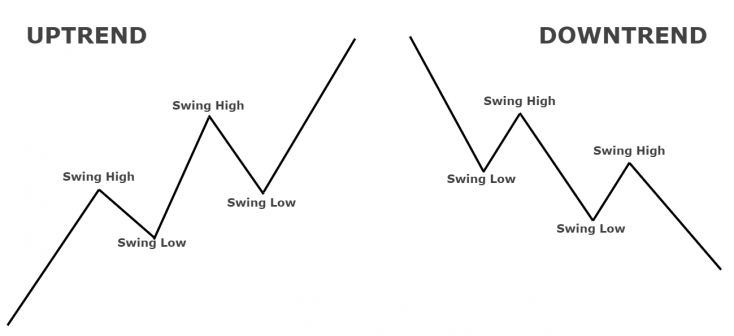
In the picture above, you can see how a typical downtrend looks like. The price keeps pushing lower with occasional counter-trend movements, i.e. price corrections. Just like in the case of bull markets, those price corrections can happen for a variety of reasons, such as profit-taking or short-term news trading.
Trend-following traders often wait for a price correction before entering in the direction of the underlying trend, as this trading approach provides a more attractive risk-to-reward ratio than simply buying at the highs or selling at the lows.
What Causes a Change in the Market Trend?
Many factors can influence the direction that markets take. Some of them are very long-term models that work for position traders and long-term investors, while others are more short-term or focused on technical analysis.
Here’s a brief list of the main factors you need to know about that can affect market trends at any time.
Fundamentals
Fundamentals play possibly the most important role in defining market trends over the medium and long-term. Even in the short run, overreaction to news and unexpected market reports can lead to sudden volatility in the markets and even establish a new short-term trend.
No matter what financial market you’re trading, you need to be aware of some major fundamentals that describe the current economic situation in a country or group of countries. Some of those fundamentals include official interest rates, inflation rates, economic growth, employment numbers, and soft data such as PMIs (Purchasing Manager Indices).
Official interest rates are set by central banks and impact all other interest rates in an economy. If you’re trading currencies, that’s the most important fundamental data you need to follow. If there’s even a hint of possible changes to the official interest rate, it can lead to the formation of new trends and the reversal of existing ones.
Inflation rates are important because central banks often have the mandate to target a specific inflation rate. High inflation rates will usually lead to higher interest rates, and vice-versa. Plus, higher inflation rates can discourage people from saving and make bonds with fixed coupons less attractive to investors.
Economic growth and employment statistics usually trend in the same direction. When an economy is doing well, more people will find jobs and the unemployment rate will fall. A stronger economy also increases the demand for the domestic currency, which can lead to a new trend or trend reversal.
- Learn more, take our free course: Reversal Price Patterns
Capital flows
The next thing you need to follow is capital flows. With an increasingly globalised economy, capital flows play an important role in global markets. One way to follow capital flows is to regularly check the CFTC.
Each Friday, the CFTC reports changes in positions in the futures market made by large market players in the Commitment of Traders report, which can then be used to assess the strength of the current trend and the possibility of a trend reversal.
There are two main reports that you need to pay attention to: The legacy report and the TIFF (Traders in Financial Futures) report. The legacy report covers commercial and non-commercial market participants and their changes in the futures market, while the TIFF report covers leveraged money, asset managers, and dealers and their changes from the previous week.
The Commitment of Traders report includes almost all futures contracts you can think about. From currencies to commodities, the CoT report includes hundreds of tradeable products.
When reading the CoT report, bear in mind that some market participants trade in the market for a profit while others are there to hedge their exposure. Commercial traders, leveraged money and asset managers usually trade in the direction of the trend, while non-commercial traders and dealers hedge their exposure in the market and trade in the opposite direction of the trend.
Another helpful report that covers capital flows is the TIC (Treasury International Capital) report, published by the US Treasury. The TIC report shows all the flows of money into and out of the US financial markets, including stocks, currencies, bonds, options, and other derivatives. It’s an important report that helps understand whether international capital fuels the current trend in US financial markets.
Risk sentiment
Risk sentiment can also impact the current market trend. When investors and traders are risk-tolerant, the equity markets usually rise while safe-havens tend to fall. Conversely, when risk sentiment falls and investors and traders become risk-averse, equities tend to fall and safe havens tend to rise.
If the current market narrative is extremely risk-averse (such as during severe economic recessions) or extremely risk-tolerant (such as when all major economies report growth rates above forecasts), risk sentiment can have a pivotal role in building new trends.
Terms of trade
Last but not least, the terms of trade of a country can impact domestic financial markets in the long-term. Terms of trade simply refers to the average cost of a country’s exports vs imports.
If the price of oil falls, it would have a negative effect on the terms of trade of an oil-producing and exporting country. The same situation would lead to an improvement in the terms of trade for a country that is dependent on the import of oil, such as China or India.
How to Trade a Trending Market: Retracements
Once you identify a bull or a bear market, it’s time to jump on the bandwagon and initiate a trade. But, at what level should you buy in a bull market and sell in a bear market?
Most traders who follow a trend-following trading strategy prefer to join the trend at pullbacks or price corrections. As you already know, price corrections are price-movements that go in the opposite direction of the overall trend.
Traders can use Fibonacci retracement levels to determine when a price-correction could end and where to join a trend. Popular Fibonacci retracement levels include the 38.2%, 50%, and 61.8% level.
The following chart shows a typical trade idea based on Fibonacci retracement levels and combined with a horizontal support zone. On the right-hand side of the chart, the GBP/USD pair started to form a new bull market with consecutive higher highs and higher lows.
- Learn more, take our free course: Fibonacci: Fast-Track
After a trader identified this bull market, he could wait for a pullback to a Fibonacci retracement level to initiate a long position. In this example, the pair retraced exactly at the 38.2% Fib level that also aligned with a major support zone, providing an attractive buying opportunity.
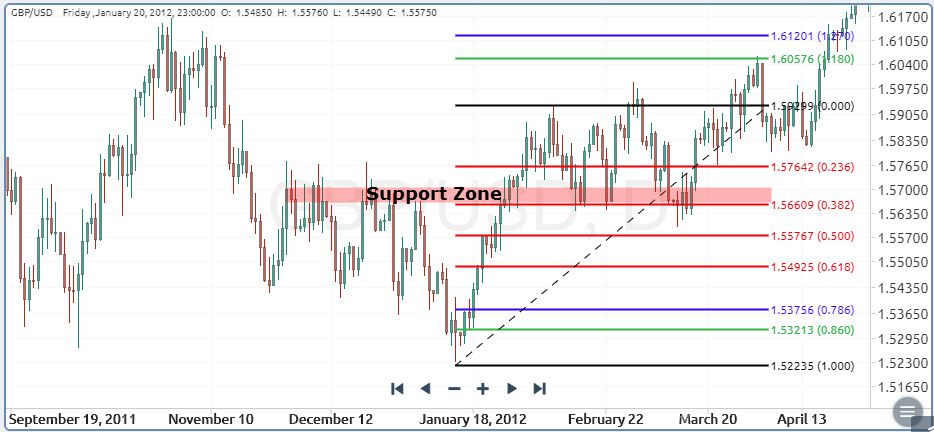
A stop-loss should be placed just below the recent swing low (support level), and a profit target could be either a Fibonacci extension level or a recent major swing high (resistance level).
Main Differences in Trading Bull and Bear Markets
Here’re the main differences between trading bull and bear markets:
- Speed of action: Bull markets tend to build up slowly and gradually, while bear markets occur fast and abruptly. If you identify a possible sign of a bull market reversal, be prepared to pull the trigger fast.
- Short-selling: To profit from a bear market and falling prices, you need to short-sell the market. In the retail-trading space, this is usually accomplished with CFDs, but you can also use put options if you think the market has more downside potential.
- Possibility of high losses: Buying into a bull market usually has a limited loss potential – Most of the time, the lowest a price can fall is $0. However, when short-selling a bear market, your potential losses are theoretically limitless as the price could keep pushing against you.
Final Words
Bull and bear markets are types of trending markets: In a bull market, prices keep pushing higher for a prolonged period, while the opposite is true for a bear market.
Identifying the current market condition is not always a simple task, as markets can be trending upwards on some timeframes, and downwards on other timeframes. The key is to stay consistent with a timeframe of your choice and have strict risk management guidelines in place to limit your losses when the price goes against you.