
The four market stages
This theory is an improvement on Dow theory, which introduced the concept of market stages, and states that all markets move through four stages of participant psychology. Stan Weinstein simplified and developed it in the 1980s.
By identifying which stage a market is in allows a trader to ‘swim with the tide’, and trade with the trend.
The four stages
The key characteristics of the four market stages theory are:
- It is not limited to equities, the four market stages cover all freely traded markets – fx, indices, commodities, debt, even property.
- While the stages do apply to the primary trend – the trend lasting a few months to a few years – they can apply to all timeframes. Like Elliott wave, the stages and participant psychology are fractal in nature.
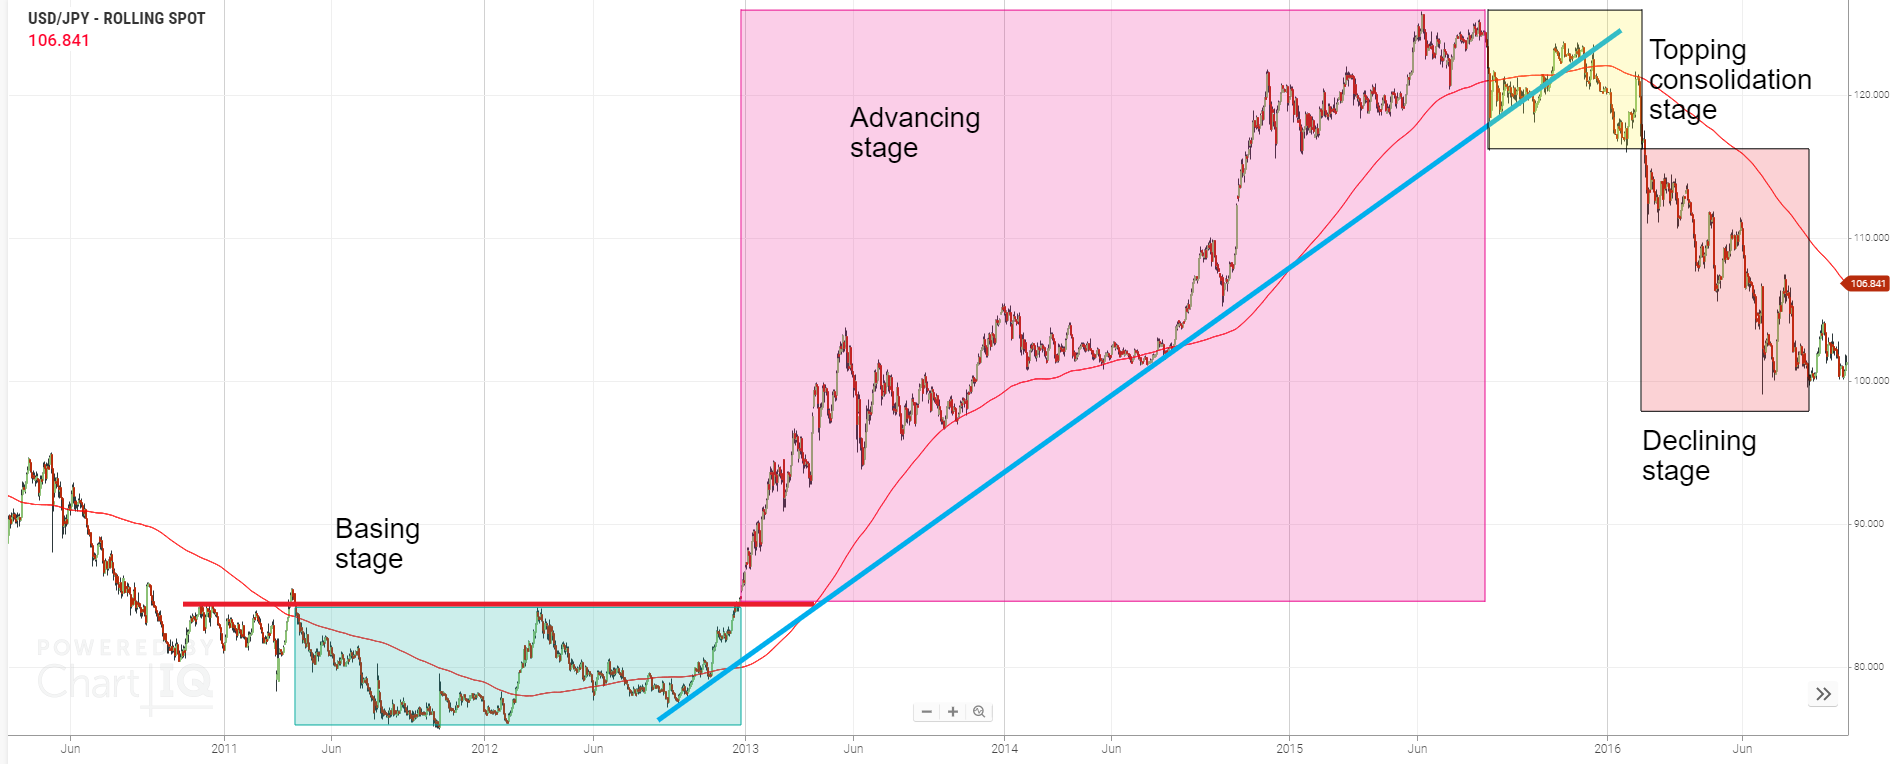
- Any freely traded market goes through these four distinct stages: basing, advancing, topping consolidation and declining.
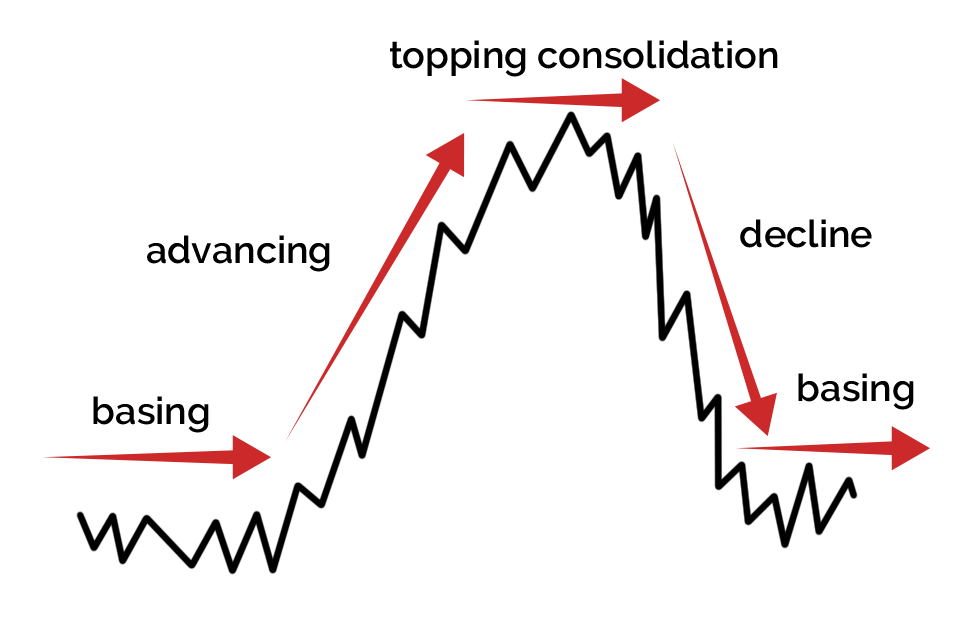
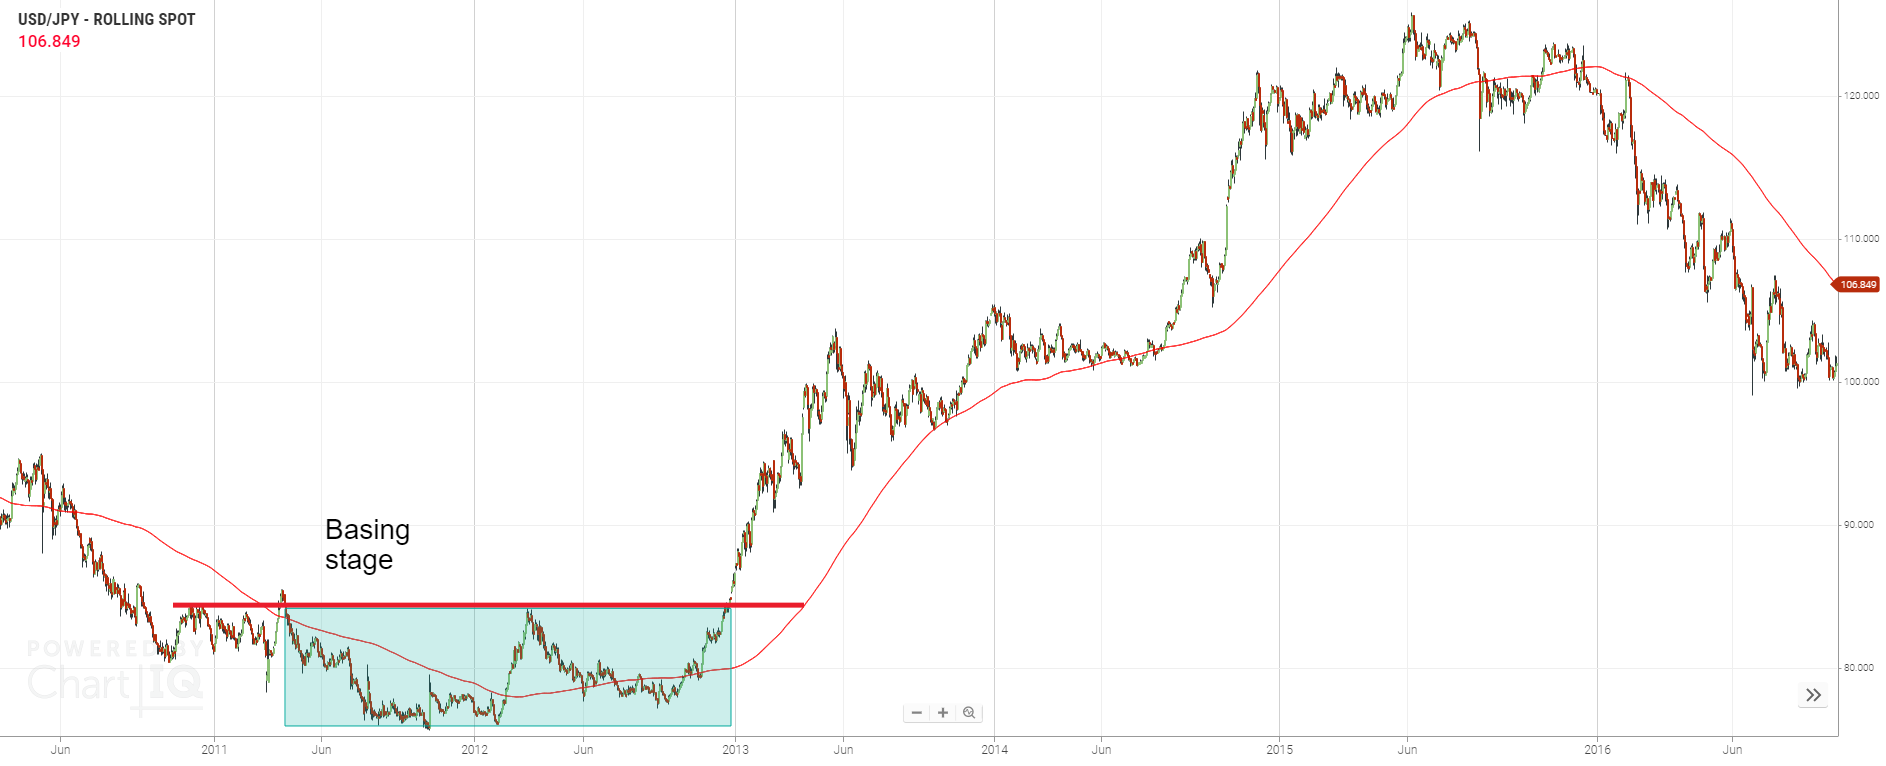
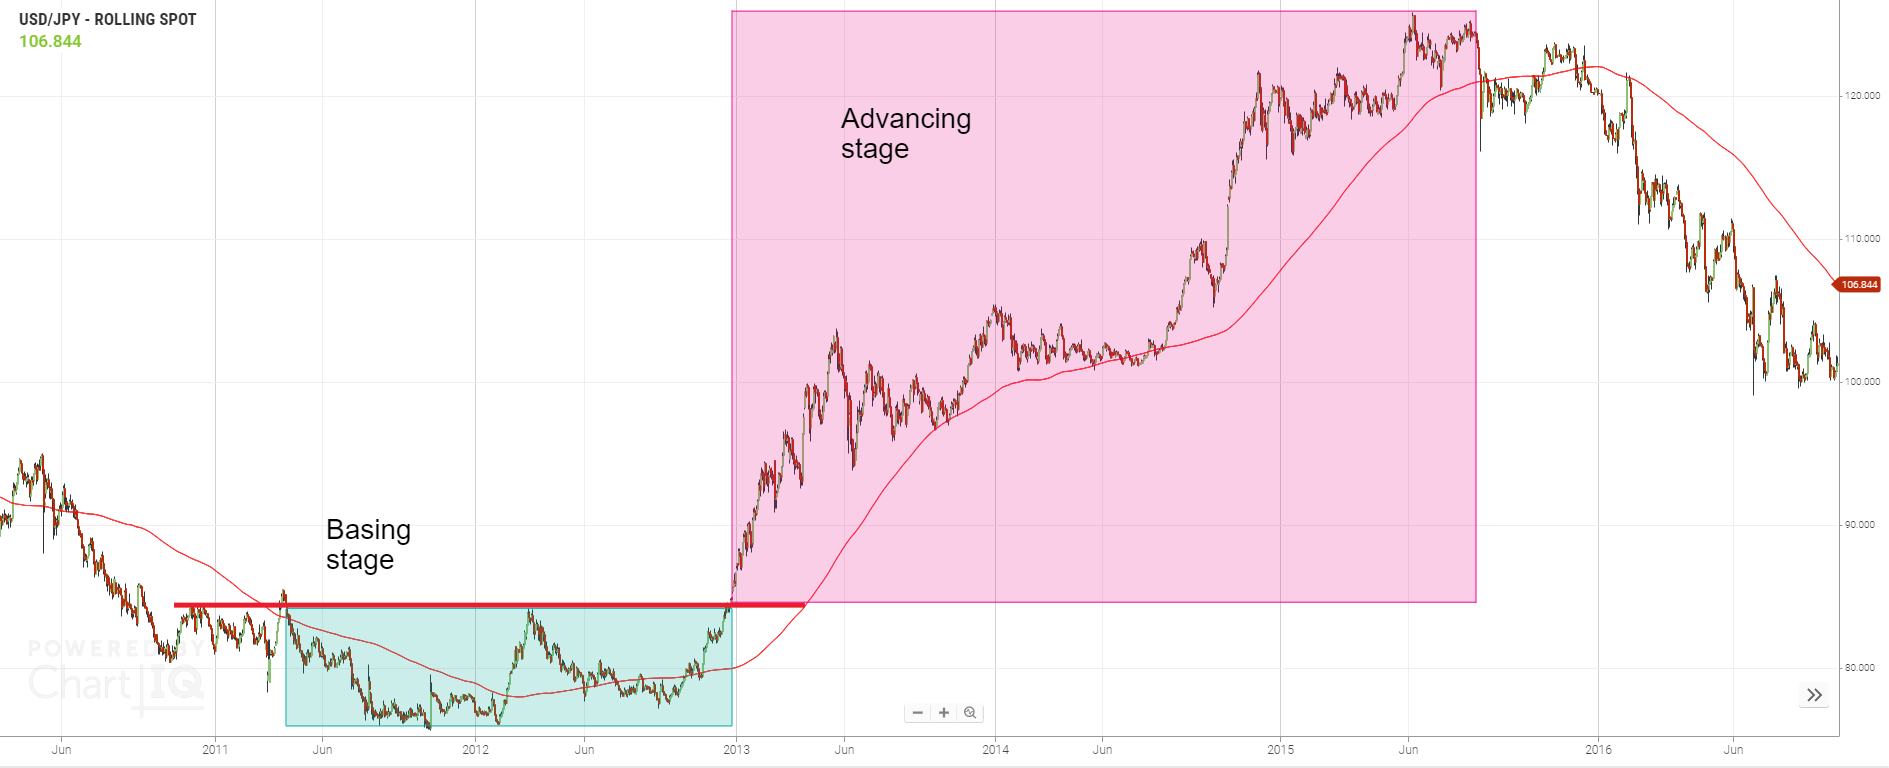
This is a sideways consolidation after a downtrend (the previous declining stage). There are a few characteristics of the basing stage:
- The market has recently experienced a significant decline.
- The 200-period simple moving average will be declining but will start to flatten out, the price will cross back and forth over it.
- The price might be ranging in a channel with a clear resistance level.
This is when the smart money buys into the market. These are the fundamental investors, like pension funds and value investors. If its shares they are buying the PE ratios are at lows. These market participants typically use cash and little or no leverage because the length of the basing stage can not be deduced.
Margin traders buying in here might be left holding, and funding a position for a long period of time.
Trend following traders should therefore not trade the basing stage.If analysing the primary trend, there might be lots of bad news coming out about the asset but the price is so beaten down these won’t impact the price much anymore. Most participants and commentators (but not the smart money) will be writing the asset off and finding reasons to justify its terminal decline.
The end of the basing and start of the advancing stage can be confirmed by these technical insights:
- The resistance of the basing stage is broken, this is potentially confirmed by a price pattern confirmation or a bullish Japanese candlestick.
- If its a share then volume starts picking up.
Trend following margin traders want to trade this stage and are waiting for the price to break the upper resistance level of the basing stage before getting into the action. The movements in this stage can be fast, this works well for margin traders because the funding cost to leverage their positions doesn’t eat into their returns too much.
By the middle of the stage, the news starts confirming the advance. Positive earnings reports, economic good news, and so on.
The technical analysis should be confirming the uptrend – the 200-period simple moving average is now sloping up, the price is above the SMA and there are higher highs and higher lows in the price action.
Trend following traders should trade the advancing stage and be looking to go long.The money in this stage will be made by investors and traders being long.
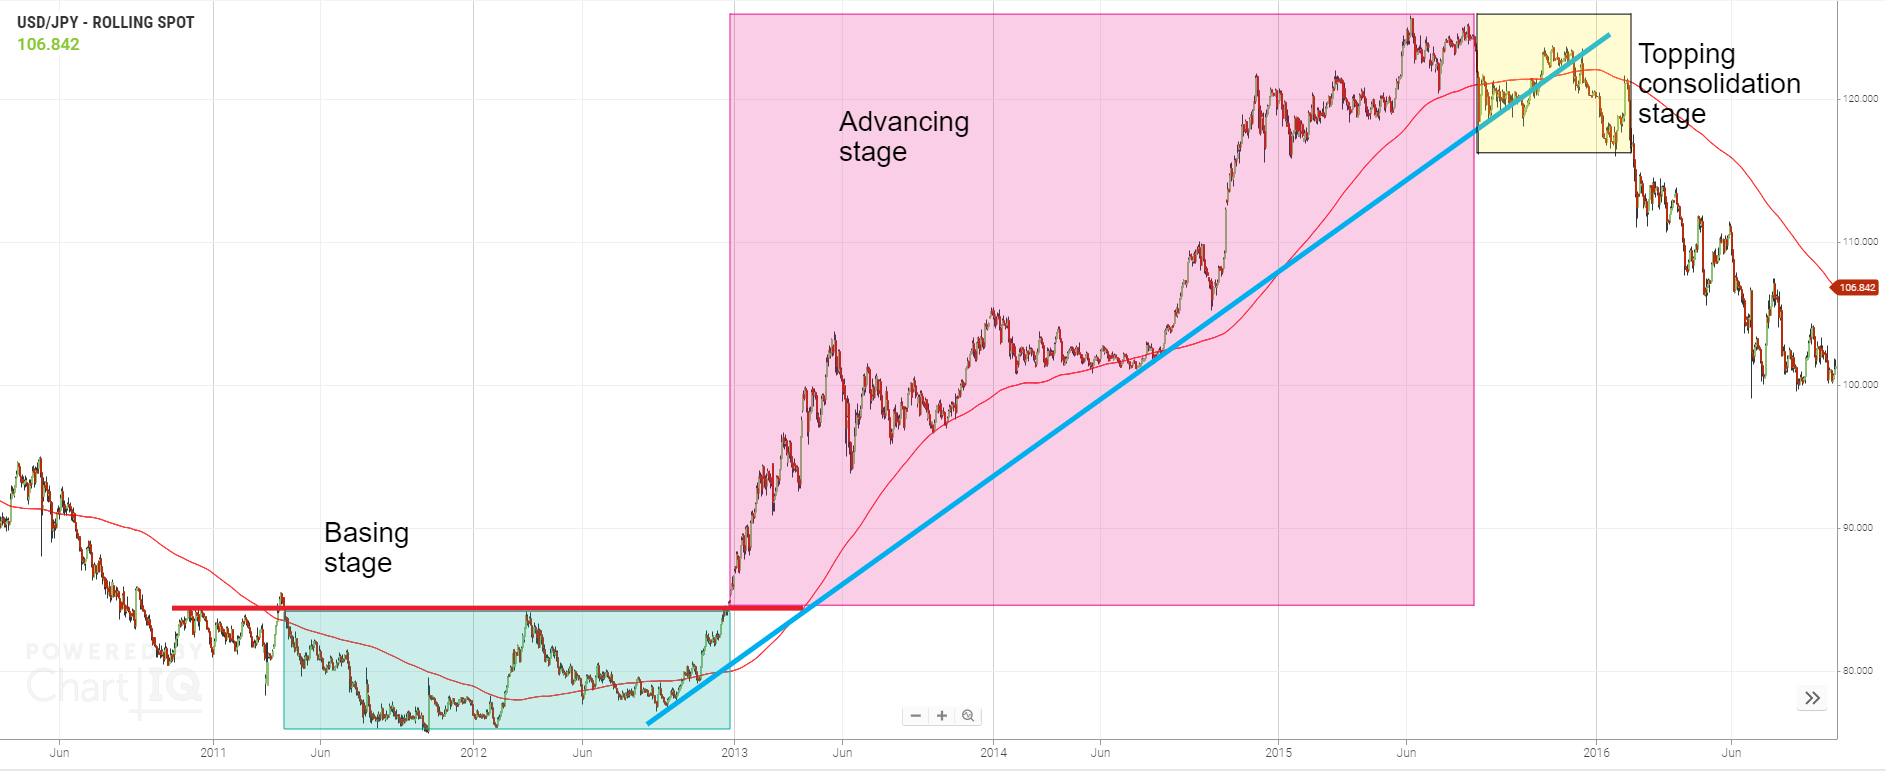
- Momentum is lost. Indicators like RSI – set to a longer time period than the standard 14 periods, start to confirm this. A long term support trendline is normally broken.
- The price starts crossing back and forth over the 200-period SMA. The SMA starts flattening out.
- In shares, there might start to be heavy volume on down days.
- You might see a topping reversal price pattern like a head and shoulders or a double top.
This happens because the large institutions, the smart money, is exiting the market and taking profits. There is a shift going on between bulls and bears.
Trend following traders should not trade the topping consolidation stage.When in the primary trend, the news is still good during the stage – companies will still be releasing good results and most economic indicators are buoyant. You start getting share trading pull-outs in the Sunday papers and books start coming out about how to trade the markets. Greed is at its height at this point, fear from the basing stage has long been forgotten.
We know a declining stage by these characteristics:
- If a support line has formed on the topping consolidation stage breaks – like one supporting a head and shoulders or double top price pattern.
- The 200-period SMA is sloping down and the price is consistently below it.
- There are lower lows and lower highs in the price action.
- On shares, the down periods have more volume than the up periods.
When considering the primary trend the news would be normal and not suggest a change – to start with. Then, negative bits of information start coming out – surprise poor earnings at a blue-chip company or an interest rate cut and so on.
You still get some investors hanging onto their long positions – greed is sometimes hard to shake.
Cycle through the USD/JPY chart tabs to see the four market stages play out.
Ignore the news
It should be pretty clear by now the news is not a good way to gauge the stages – why? Well, news normally lags quite significantly. The market has to wait months to get a GDP figure, or for a company earnings to be reported.
To sum up
At the start of this course, we said 70% of the price moves happen in 20% of the time. You should be starting to see why this happens and how the four market stages theory helps us – there are two clear stages – advancing and declining – where the majority of price action happens. Trade in the direction of these two stages and you should be well set as a trend following trader.
- The four market stages theory builds on Dow theory.
- Markets move through four stages: basing, advancing, topping consolidation and declining.
- Use technical analysis techniques to identify the stage and when it shifts to the next one.
- Techniques like analysis of the 200-period SMA and price patterns help with this.
- Ignore the news – it lags the markets and doesn’t help with stage identification.
- Knowing the stage a market is in helps trend following traders understand which direction to trade – or if they should even trade at all.